-
WANTED: Happy members who like to discuss audio and other topics related to our interest. Desire to learn and share knowledge of science required. There are many reviews of audio hardware and expert members to help answer your questions. Click here to have your audio equipment measured for free!
You are using an out of date browser. It may not display this or other websites correctly.
You should upgrade or use an alternative browser.
You should upgrade or use an alternative browser.
Keith_W DSP system
- Thread starter Keith_W
- Start date
I couldn't investigate the data deeply yet, I will need to check in the evening but your subs might need to be inverted from what I could see. XO1 is doing it with a lot of extra work afterwards. Also your near field sub measurements seem to have all the front/side/rear wall reflections in them. Does it make sense to phase align them upfront for all these reflections and then re-do all that again at the LP? I also couldn't understand why XO4 for the tweeter has so much phase correction in it below 500Hz.EDIT. Decided to delete the measurements I posted earlier. I will redo them.
Keith_W
Major Contributor
- Thread Starter
- #63
I couldn't investigate the data deeply yet, I will need to check in the evening but your subs might need to be inverted from what I could see. XO1 is doing it with a lot of extra work afterwards. Also your near field sub measurements seem to have all the front/side/rear wall reflections in them. Does it make sense to phase align them upfront for all these reflections and then re-do all that again at the LP?
That was what I was wondering. In one of my iterations, I did invert the subwoofers. It sounded extremely strange. So I un-inverted them.
I also couldn't understand why XO4 for the tweeter has so much phase correction in it below 500Hz.
Not sure what you mean. The tweeter crossover does not go below 5kHz, unless you made a typo and missed out a 0. If you are talking about this:
You will see that the phase is corrected only within the tweeter band. All that rubbish below 2.5kHz is noise which is -90dB. I suppose I should remove it
Anyway, I have redone the DSP and reuploaded the .MDAT's. If you have downloaded them before, only the third one has changed.
These are snapshots of the system at various stages in the correction.
1. The first step is to take nearfield measurements of all the drivers.
Uncorrected raw driver measurements.mdat
2. Then the drivers are linearized and phase corrected.
Corrected driver measurements.mdat
3. The above correction is then convolved with the crossover and time alignment performed. Included in this file are all the raw crossovers pre-room correction, and full sweeps at the MLP pre and post room correction. There are also two versions. The first version is with a different time alignment strategy, and the measurements performed at MLP with the sofa in situ. An artificial target curve was used to mimic the effect of the sofa. The second version was redone today, with Acourate's recommended time alignment procedure (I think I screwed it up, the step response shows that the subs are clearly not aligned). I have included measurements performed at the MLP pre and post correction, with no sofa in situ.
Linearized XO's, sweeps pre and post room correction.mdat
Keith_W
Major Contributor
- Thread Starter
- #66
Anyway, its probably insignificant as these are way below noise level as you said. Can I have the details of the final crossover filters and time delays without the correction filters?
I can not remove the time delays because I baked them into the filters before performing DRC. But of course I can share the finalized XO's post DRC. These were the same XO's used to generate the full sweeps:
Post DRC XO's
I still think your subs should be inverted and you may not need to have that hole around 60Hz. Anyways, I preferred to work on pre RC measurements (not pre RCIIs) and created this very safe phase correction filter which seemed to match both your speakers:

and merged that with some new tech inversion filters working below Schroeder's. I don't think you need any filters beyond that but your horn/tweeter - whatever it's at work after 5Khz needs around 6dB boost!

Mono 48kHz convolution filters for left and right speaker as well as mdat and rePhase file are all in the link below.
It's very difficult without knowing which filter is being applied when and what's the final time alignments. etc. but give it a try.
and merged that with some new tech inversion filters working below Schroeder's. I don't think you need any filters beyond that but your horn/tweeter - whatever it's at work after 5Khz needs around 6dB boost!
Mono 48kHz convolution filters for left and right speaker as well as mdat and rePhase file are all in the link below.
It's very difficult without knowing which filter is being applied when and what's the final time alignments. etc. but give it a try.
ernestcarl
Major Contributor
Now that is quite intriguing. I notice it has 18" diameter, which is the same diameter as my horn - so it will have the same visual footprint. The directivity measurements on that page look amazing. I will go read more about this. It looks as if it has enough flaws in it for some fun.
I first heard of this driver from @voodooless in another thread about "crazy coaxials". I would imagine designing and building a cabinet to house the driver would be easy. The manufacturer does give indication on where to xo, but everything else is going to be up to the speaker system designer to decide e.g. amplification, passive components, DSP.
ernestcarl
Major Contributor
I couldn't investigate the data deeply yet, I will need to check in the evening but your subs might need to be inverted from what I could see. XO1 is doing it with a lot of extra work afterwards. Also your near field sub measurements seem to have all the front/side/rear wall reflections in them. Does it make sense to phase align them upfront for all these reflections and then re-do all that again at the LP? I also couldn't understand why XO4 for the tweeter has so much phase correction in it below 500Hz.
So phase and magnitude linearization is first performed in-room very nearfield and then at the MLP? I think that method would be work well with some coaxials... Eh, still it's confusing/difficult for me to translate the workflow from Accourate.
I've referenced my nearfield measurements, but mainly to see what the filters designed for the far away MLP(s) does to it.
I second that!confusing/difficult for me to translate the workflow from Accourate
- Joined
- Jul 10, 2019
- Messages
- 124
- Likes
- 339
Eh, still it's confusing/difficult for me to translate the workflow from Accourate.
I second that!
Can you guys describe me a correct and nice workflow from driver measurement, driver linearization, addition of crossovers, time alignment, overall measurement and overall correction?
Possibly in another thread to avoid hijacking Keith's thread.
I'm really curious.
I guess a clarification is due. I have nothing against the methods or the workflow of Acourate, in fact quite the opposite!Can you guys describe me a correct and nice workflow from driver measurement, driver linearization, addition of crossovers, time alignment, overall measurement and overall correction?
Possibly in another thread to avoid hijacking Keith's thread.
I'm really curious.
I was (and I am sure so was Ernest) just referring to my lack of familiarity with the user interface and graphs. We needed 10 minutes with Keith to finally level and compare group delay charts today.
- Joined
- Jul 10, 2019
- Messages
- 124
- Likes
- 339
Indeed I would be very happy if there was a general standard for creating and manipulating (e.g. zooming) charts. So all developers rely on the chosen chart library.I was (and I am sure so was Ernest) just referring to my lack of familiarity with the user interface and graphs. We needed 10 minutes with Keith to finally level and compare group delay charts today.
For the users there is always the learning curve to get used to the chart handling. Of course I have no problems with my charts but always fiddle around when I use e.g. REW. As the underlying library is different it is nearly impossible to adopt to other charts. Sorry about that.
ernestcarl
Major Contributor
Can you guys describe me a correct and nice workflow from driver measurement, driver linearization, addition of crossovers, time alignment, overall measurement and overall correction?
Possibly in another thread to avoid hijacking Keith's thread.
I'm really curious.
I do get the general gist -- and can see the logic in what's performed. Personally, apart from the charts, it's the labeling as well and lack of familiarity with the details of the workflow. I'm sure those who use Acourate itself regularly would find not much problem with understanding fully what's presented.
For example, the supposedly "uncorrected" REW mdat file set @Keith_W uploaded show us measurements seeming to have at least some processing applied. My definition of "uncorrected" would be a raw sweep with absolutely zero EQ if at all possible. The "corrected" nearfield curves' magnitude level are also significantly offset the original "uncorrected" curves -- I'm just talking about data exported into REW -- again, this just adds to the confusion for me.
3ll3d00d
Active Member
- Joined
- Aug 31, 2019
- Messages
- 213
- Likes
- 177
@Keith_W I notice these are aligned so the IR peak is T=0 & I can see the XO comes from individual wav files so I'd think it means any rotation applied to each individual one is lost in translation. Probably fine for the full range measurements (as that's effectively how acourate shows things, i.e. aligned to the tweeter) so might not be a problem but thought I'd mention it in case you're not aware of that effect when exporting via REW.
the uncorrected one is just NF measurements isn't it? what processing do you see?the supposedly "uncorrected" REW mdat file set @Keith_W uploaded show us measurements seeming to have at least some processing applied
fwiw acourate basically measures in dBFS terms so loading into REW is going to produce large numbers, it will optionally remember the level of a specific measurement so all subsequent measurements are referenced to that (i.e. you can measure in a way that preserves relative gain) but that's still going to produce big numbers in REW and you can, and do, still reset that at arbitrary times because the absolute level is not really relevant when using acourate.The "corrected" nearfield curves' magnitude level are also significantly offset the original "uncorrected" curves -- I'm just talking about data exported into REW
ernestcarl
Major Contributor
the uncorrected one is just NF measurements isn't it? what processing do you see?
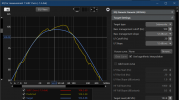
It's not possible for me to totally remove the built-in processing of my speakers, but the ff. is a comparison of Keith's custom dual opposed Rythmik sub uncorrected vs my Rythmik F12 (rumble filter disabled, damping set at high, LPF AVR/12dB per oct. [
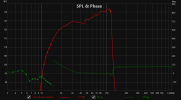
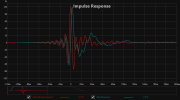
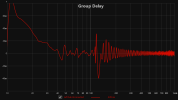
There's quite a bit more pre- and post-ringing in the IR (and phase linearized) above for me to believe absolutely no pre-processing was applied whatsoever.
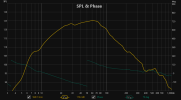
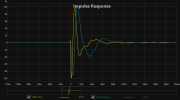
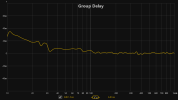
*my bad, actually, checking again, it does seem more like 100 Hz is the real built-in LPF:
fwiw acourate basically measures in dBFS terms so loading into REW is going to produce large numbers, it will optionally remember the level of a specific measurement so all subsequent measurements are referenced to that (i.e. you can measure in a way that preserves relative gain) but that's still going to produce big numbers in REW and you can, and do, still reset that at arbitrary times because the absolute level is not really relevant when using acourate.
Thanks for the explanation. That, and as you mentioned together with the impulse centering at t=0 when exported makes it not immediately obvious to us folks using REW only viewing the measurements what the actual alignment is of the drivers relative to each other.
Last edited:
Keith_W
Major Contributor
- Thread Starter
- #79
I guess a clarification is due. I have nothing against the methods or the workflow of Acourate, in fact quite the opposite!
Thanks for the chat session yesterday! I learnt a new method of obtaining delays from looking at GD/impulse charts. I haven't tried it yet, but I will give it a go and compare the results to the standard Acourate method.
I do get the general gist -- and can see the logic in what's performed. Personally, apart from the charts, it's the labeling as well and lack of familiarity with the details of the workflow. I'm sure those who use Acourate itself regularly would find not much problem with understanding fully what's presented.
For example, the supposedly "uncorrected" REW mdat file set @Keith_W uploaded show us measurements seeming to have at least some processing applied. My definition of "uncorrected" would be a raw sweep with absolutely zero EQ if at all possible. The "corrected" nearfield curves' magnitude level are also significantly offset the original "uncorrected" curves -- I'm just talking about data exported into REW -- again, this just adds to the confusion for me.
All software packages do things differently and require familiarization. It may also be my fault for not explaining the workflow more clearly. I am much less familiar with REW because I don't use it as often. I prefer doing my measurements with Acourate for a couple of good reasons: (1) I can directly manipulate the curves if I do it in Acourate, and (2) it has a built-in convolver. This means I can use Acourate to directly test my filters. If want to do a full spectrum sweep on REW, I have to route the signal through a third party convolver like JRiver. Of course I can use REW to test individual channels, it is great for that.
@Keith_W I notice these are aligned so the IR peak is T=0 & I can see the XO comes from individual wav files so I'd think it means any rotation applied to each individual one is lost in translation. Probably fine for the full range measurements (as that's effectively how acourate shows things, i.e. aligned to the tweeter) so might not be a problem but thought I'd mention it in case you're not aware of that effect when exporting via REW.
Good point! It is possible that something is lost in translation when I export files from Acourate to REW. To be honest, I didn't look closely - I exported the files, renamed the curves to make it easier to interpret, and made it available.
Keith_W
Major Contributor
- Thread Starter
- #80
BASS MANAGEMENT PART 2: Virtual Bass Array
Dr. Uli posted a description of how to create a VBA a few years ago: link. There are more resources including @René - Acculution.com thread on ASR here, @Tim Link thread on ASR here, and @OCA video here:
I thought it sounded insanely cool. Cancelling bass reflections with a delayed and inverted signal should not only smooth out bass response in the MLP, it should also smooth out response around the room and reduce bass ringing. To my knowledge, the idea first surfaced in a German forum in the early noughties as a double bass array, before they realized you could do it with a single bank of subwoofers.
The problem is working out the delay and the attenuation, because it can not be measured with signal. You have to measure with tape measure, then work out the delay using the speed of sound. There is absolutely no way to measure the attenuation required, so you start with a guess, and then you adjust the attenuation until the measured bass response looks good.
I attempted creating the VBA via two methods, which I will describe. Of course I did not invent these methods (in fact, I don't know who did). I can credit whom I learnt it from, but I don't know if they invented those methods either.
Method 1: Room Geometry

(Yes I know my room is not a perfect box, there are avenues for bass to escape in the lower right. But let us assume for the moment that it behaves like a box for modelling purposes).
- C: The first step find the delay between the subwoofer to the tweeter plane. This is because there are two types of delays introduced by the subwoofer, (1) time of flight from subwoofer to tweeter plane, and (2) propagation delay through the DSP. The former can be accounted for by distance measurements, but the latter needs to be measured using signals. I measure this delay using Acourate's time alignment method which I will discuss later. When I measured my subwoofer delay, it was 200 samples at 48kHz for the left sub, and 220 samples for the right sub. You can convert this to time if you wish, but I prefer to leave them as samples because they will be converted back to samples later.
- A: Now that we have aligned the subwoofer to the tweeter plane, we can assume that the subs are at the location of the tweeters. The "subwoofer" produces a wavefront which travels to the back wall, reflects, and arrives at the MLP. We therefore need to measure distance from sub to rear wall, and rear wall to MLP. In my room, these distances are 5m and 1.8m respectively, or 6.8m in total. Convert this into time, 6.8/343*1000 = 19.83ms.
- B: now we want the cancellation signal to launch and arrive at the MLP at the same time the first reflection arrives, so we measure distance from the sub to the MLP. In my room, this is 4.2m, or 12.24ms.
- the delay required is (A - B) + C, so (19.83 - 12.24) + C = 7.59 + C. To convert this into samples at 48kHz, it is (7.59 * 48) or 364 samples. We have determined separately that C = 200 samples for the left sub, and 220 samples for the right sub.
Now we have the delay worked out, we go to Acourate.
1. Generate-Crossover, Butterworth, 150Hz, 4th order (I only want to correct to 150Hz). Load XO1L/R into curves 1 and 2.
2. Apply to both XO1L/R TD-Functions - Phase Extraction, MinPhase, start 20, end 400, result into curves 3 and 4.
3. Now we apply the delays and attenuation, and invert the sub so that it generates a cancellation frequency. Uli recommends a starting attenuation of 0.7, so that's what I went with. Modify the MinPhase curves (3 and 4) as follows:
- LEFT: 364 + 200 = 564 samples. Rotate +564 samples, Gain factor 0.7, TD-Functions Change Polarity
- RIGHT: 364 + 220 = 584 samples. Rotate +584 samples, Gain factor 0.7, TD-Functions Change Polarity
*** NOTE if you have already baked the time alignment into your subwoofer XO, as I have, DO NOT add additional delays for the sub! Only rotate by the estimated room delays!
4. Clear curves 1 and 2. Now create the initial Dirac pulse: Generate-Testfilter, Samplerate 65536, sample 0, length 1 into Curves 1 and 2.
5. Add Curves 1 + 3, and 2 + 4 into 5 and 6. Save Curve 5 as "PreVBAL" and Curve 6 as "PreVBAR". This is what you should see:

6. As a quick check, load up one of your MLP full frequency sweeps and check if it is a good match:

Here the left VBA (in red) is compared to the left sub/speaker (in brown). If done correctly, the peaks should match the dips. You can see that this VBA is a reasonable match. Of course, it won't match every peak and dip, because we have only accounted for length reflections, and not any of the other modes.
7. When you do your DRC step using Acourate's room macros, load PreVBAL/R into Room macro 0 as prefilters. Then proceed as normal.
8. Perform verification measurements. It is likely that adjustment will be required. So go back to step 1 and repeat the whole exercise trying different attenuation (I settled on 0.5). It took me days to get it right with multiple rinse-and-repeat cycles.
Dr. Uli posted a description of how to create a VBA a few years ago: link. There are more resources including @René - Acculution.com thread on ASR here, @Tim Link thread on ASR here, and @OCA video here:
I thought it sounded insanely cool. Cancelling bass reflections with a delayed and inverted signal should not only smooth out bass response in the MLP, it should also smooth out response around the room and reduce bass ringing. To my knowledge, the idea first surfaced in a German forum in the early noughties as a double bass array, before they realized you could do it with a single bank of subwoofers.
The problem is working out the delay and the attenuation, because it can not be measured with signal. You have to measure with tape measure, then work out the delay using the speed of sound. There is absolutely no way to measure the attenuation required, so you start with a guess, and then you adjust the attenuation until the measured bass response looks good.
I attempted creating the VBA via two methods, which I will describe. Of course I did not invent these methods (in fact, I don't know who did). I can credit whom I learnt it from, but I don't know if they invented those methods either.
Method 1: Room Geometry
(Yes I know my room is not a perfect box, there are avenues for bass to escape in the lower right. But let us assume for the moment that it behaves like a box for modelling purposes).
- C: The first step find the delay between the subwoofer to the tweeter plane. This is because there are two types of delays introduced by the subwoofer, (1) time of flight from subwoofer to tweeter plane, and (2) propagation delay through the DSP. The former can be accounted for by distance measurements, but the latter needs to be measured using signals. I measure this delay using Acourate's time alignment method which I will discuss later. When I measured my subwoofer delay, it was 200 samples at 48kHz for the left sub, and 220 samples for the right sub. You can convert this to time if you wish, but I prefer to leave them as samples because they will be converted back to samples later.
- A: Now that we have aligned the subwoofer to the tweeter plane, we can assume that the subs are at the location of the tweeters. The "subwoofer" produces a wavefront which travels to the back wall, reflects, and arrives at the MLP. We therefore need to measure distance from sub to rear wall, and rear wall to MLP. In my room, these distances are 5m and 1.8m respectively, or 6.8m in total. Convert this into time, 6.8/343*1000 = 19.83ms.
- B: now we want the cancellation signal to launch and arrive at the MLP at the same time the first reflection arrives, so we measure distance from the sub to the MLP. In my room, this is 4.2m, or 12.24ms.
- the delay required is (A - B) + C, so (19.83 - 12.24) + C = 7.59 + C. To convert this into samples at 48kHz, it is (7.59 * 48) or 364 samples. We have determined separately that C = 200 samples for the left sub, and 220 samples for the right sub.
Now we have the delay worked out, we go to Acourate.
1. Generate-Crossover, Butterworth, 150Hz, 4th order (I only want to correct to 150Hz). Load XO1L/R into curves 1 and 2.
2. Apply to both XO1L/R TD-Functions - Phase Extraction, MinPhase, start 20, end 400, result into curves 3 and 4.
3. Now we apply the delays and attenuation, and invert the sub so that it generates a cancellation frequency. Uli recommends a starting attenuation of 0.7, so that's what I went with. Modify the MinPhase curves (3 and 4) as follows:
- LEFT: 364 + 200 = 564 samples. Rotate +564 samples, Gain factor 0.7, TD-Functions Change Polarity
- RIGHT: 364 + 220 = 584 samples. Rotate +584 samples, Gain factor 0.7, TD-Functions Change Polarity
*** NOTE if you have already baked the time alignment into your subwoofer XO, as I have, DO NOT add additional delays for the sub! Only rotate by the estimated room delays!
4. Clear curves 1 and 2. Now create the initial Dirac pulse: Generate-Testfilter, Samplerate 65536, sample 0, length 1 into Curves 1 and 2.
5. Add Curves 1 + 3, and 2 + 4 into 5 and 6. Save Curve 5 as "PreVBAL" and Curve 6 as "PreVBAR". This is what you should see:
6. As a quick check, load up one of your MLP full frequency sweeps and check if it is a good match:
Here the left VBA (in red) is compared to the left sub/speaker (in brown). If done correctly, the peaks should match the dips. You can see that this VBA is a reasonable match. Of course, it won't match every peak and dip, because we have only accounted for length reflections, and not any of the other modes.
7. When you do your DRC step using Acourate's room macros, load PreVBAL/R into Room macro 0 as prefilters. Then proceed as normal.
8. Perform verification measurements. It is likely that adjustment will be required. So go back to step 1 and repeat the whole exercise trying different attenuation (I settled on 0.5). It took me days to get it right with multiple rinse-and-repeat cycles.
Last edited:
Similar threads
- Replies
- 2
- Views
- 421
- Replies
- 17
- Views
- 2K
- Replies
- 150
- Views
- 18K
