Do you think so?For low frequencies there would be no real comb filtering.

-
Welcome to ASR. There are many reviews of audio hardware and expert members to help answer your questions. Click here to have your audio equipment measured for free!
You are using an out of date browser. It may not display this or other websites correctly.
You should upgrade or use an alternative browser.
You should upgrade or use an alternative browser.
Room equalization through inverse delayed and attenuated bass signals
- Thread starter Tim Link
- Start date
Part II - RESULT
The theoretical benefits of a VBA are as follows:
1. Improved lower frequency response
2. More even overall room response
3. Reduced bass ringing
This is provided the sub and listening room configuration is suitable for a VBA. This is a diagram of my listening room, along with the positions of the microphone.


Result 1: Mic at MLP. The result actually looks slightly worse with the VBA. Without VBA, bass is absolutely flat +/- 2dB from 25Hz - 100Hz. A very impressive result. With VBA, a couple of dips appear at 35Hz and 65Hz.

Result 2: Left sofa. I was hoping to see a much flatter bass response than this. As you can see, it does have an effect, but not much. And it's not all good. It appears to slightly attenuate the bass peak at 35Hz, but it deepens the bass nulls at 65Hz and 95Hz.
Result 3: reduced bass ringing. Oops, I forgot to crack out REW to generate a waterfall to check this. Maybe tomorrow
Result 4: Subjective impressions. I DO NOT HEAR A DIFFERENCE! I think that the bass seems more even while walking around the room, but to be honest I am probably fooling myself.
Possible reasons for failure:
1. Improperly calculated delay for the cancellation pulse.
2. Incorrect attenuation of cancellation pulse (I used a factor of 0.7).
3. Room configuration does not support a VBA. Note the large open space at the bottom left corner that opens into an adjacent dining room.
4. The VBA model I implemented is oversimplified. It only accounts for room length modes, and not diagonals or width modes or any of the other modes.
5. The non-VBA curve is already so good that VBA will barely improve it. Yes, this is a shameless endorsement for Acourate.
6. I screwed up somewhere, I just don't know where yet.
Conclusions:
1. In the main listening position, the impressively flat bass response suggests that a VBA is not required.
2. However in the left sofa, bass response is noticeably lumpy. There is more bass, and there are +/- 15dB swings in bass response. I will need to think about how much I really want to even out the bass response at the left sofa.
")
Uli is not generating the minimum phase version of the VBA filter. That totally removes extra group delay introduced by VBA.I was inspired by this thread, so I implemented a VBA tonight using Acourate. This post will be split in two, one for the method (so that other Acourate users can follow / criticize), and the other discussing the result.
I followed @UliBru's instructions here. I adapted his instructions and came up with my own workflow.

1. Find the delay of the subwoofers. I have previously gone through the time alignment procedure, so I simply loaded those curves. For the curves that you see above, the tweeter has been delayed by 1000 samples. I performed a sweep with only the sub and the tweeter turned on, which results in the two peaks you see above. The BIG peak is the tweeter, which Acourate automatically positions at sample 6000. So it becomes a matter of reading off the position of the bass peak in relation to the tweeter. Because the tweeter is delayed by 1000 samples, and is positioned at sample 6000, we expect to find the subs at sample 5000. In this case:
- Left sub: at sample 5624. Therefore 624 samples delayed.
- Right sub: at sample 5661. Therefore 661 samples delayed.
2. Calculate the delays as follows, and then subtract the sub delay. Because the output of the sub has to travel the length of the room and reflect back, the distance (and time) covered is twice the length of the room.
- Formula: t = 2 * room length / speed of sound
- Speed of sound is 343m/s; Room length is 7m.
- 2 * 7 / 343 = 40.81ms or 0.04081632653s
- at 48kHz, 0.04081s is (48000 * 0.04081) = 1959.18367344 samples
- Subtract delay of LEFT: 1959 - 624 = 1335 samples
- Subtract delay of RIGHT: 1959 - 661 = 1298 samples
- Take note of these values for Step 4.
3. Create the filter. Here, we are only correcting to 150Hz.
- Generate-Crossover. Butterworth, 150Hz, 4th order. Load XO1L and XO2L into curves 1 and 2.
- Then apply to XO1L and XO1R TD Functions-Phase Extraction. Minphase, start 20, end 400 into Curve 3 and 4.
4. Now we apply the delays and attenuation to the filter. Use the delays calculated in step 2, and I am using an attenuation factor of 0.7 (as per Uli). Modify the Minphase curves (3 and 4) as follows:
- Left: Rotate 1335 samples, Gain factor 0.7; TD-Functions Change Polarity to invert the sub response.
- Right: Rotate 1298 samples, Gain factor 0.7; TD-Functions Change Polarity
5. Clear Curves 1 and 2. Now create the initial Dirac pulse: Generate-Testfilter, Samplerate 65536, sample 0, length 1 into Curves 1 and 2.
6. Add Curves 1 + 3, and 2 + 4 into 5 and 6 to obtain this result:

7. Save Curve 5 (Sum13) as PrefilVBAL; Curve 6 (Sum24) as PrefilVBAR. These will be your left and right prefilters respectively. Here we can see the result. Note the negative deflection in the time graph (lower), indicating the sub will output a cancellation signal at the specified time. Here, at 0.0278 seconds, or 27.8 milliseconds. As per above, I delayed the left sub by 1335 samples. At 48kHz, this is (1335/48) = 27.8ms.

8. Compare your generated VBA filter with the uncorrected room response. You can see that the peaks and nulls of the filter align almost with the peaks and nulls in the uncorrected room response - at least up to 150Hz (which is as far as I designed this filter to work). The reason for the discrepancy is because we are working with room geometry rather than actual measurements, so further iterations will need different inputs to account for the fact that the subs are not exactly flush at the front wall, and I have dipole subs.
9. Load the prefilters generated in Step 7 into Macro 0 in Acourate's room correction then proceed as normal.
10. Do a verification sweep, then sit back and analyse the result. Then go back to step 1 with new inputs and repeat until satisfied.
I have recently combined VBA_MP with a low shelf filter and now I have more bass than I'll ever need (red-original vs blue-post vba responses):
At the LP everything is great but other areas in the room are booming with excessive bass since the applied EQ don't work in all areas so definetely not neighbor friendly!
Comb filtering is a filter that repeats its nulls at wavelength/N.Do you think so?
in the lower sub range lets say 20Hz this wave length is 17 meters.
with room sizes significantly smaller than that the reflections are less likely to be consistent at multiples of 20Hz.
It all depends on room shape and size of course but in general I think its true.
You have other experiences?
For low frequencies there would be no real comb filtering.
Wikipedia says - In signal processing, a comb filter is a filter implemented by adding a delayed version of a signal to itself, causing constructive and destructive interference.
For our discussion I guess there are 2 forms of comb filtering - signal, as per the wiki quote; and physical (ie, in the air/the actual air pressure waves), due to different sources of the same frequency (due to stereo speakers or reflection points). VBA from a pair of tower speakers can possibly have problems with both forms.
The signal side is "first", because like I showed in Audacity, and depending upon the delay and the source signal (the song), you don't necessarily get a burst of signal and then a burst of anti-signal, but instead you get a summed signal that equates to a phase shifted and attenuated signal (or if the signals align perfectly opposite, you will get no signal). And when OCA's VBA IR is applied to a continuous tone, it has a transition in and out "of the IR" that will translate to in-room volume bursts and phase shifts
A peaking room mode (when the reflections overlap) occurs at half that length though, so 8.5m room for 20Hz. This is why OCA and Keith_W have issues around 33Hz, because they must have 5m rooms. I have a 4m room and it will be about 43Hz.in the lower sub range lets say 20Hz this wave length is 17 meters.
None of these images are appearing for me. They are in your previous post though. Hosting bandwidth issue?Part II - RESULT
I found more evidence that this is the case;maybe they are using the "unused" spectrum of each component to do the cancellation?
Edit: Here is exactly what I am saying. This is the estimated in room response of my Kali IN-8 with an 80Hz HPF (xover) applied. This means the speaker isn't responsible for playing 43Hz, but my sub will be. But the speaker can still play a lot of sound at 43Hz, so then I merge in a phase shifted and volume boosted (possibly via IR method), and the end result could look like this;ART handles all filtering. Mains go to around 20-25Hz and subs 20-150Hz

Also in a video I am watching at the moment, Dr Ericsson of Dirac says "we cancel out the reflections and the wave just propagates through the room". Again I am wondering if they are cancelling in advance of the song, to "clean up the room" before the actual sound wave propagates?
Last edited:
Indeed, so this shows in the impulse response as a kind of sharp peak at that delayed time.Wikipedia says - In signal processing, a comb filter is a filter implemented by adding a delayed version of a signal to itself, causing constructive and destructive interference.
To have a comb filter at n*20Hz this would mean a sharp peak in the impulse response at 50Msec!
Never seen a living room like that
")
Keith_W
Major Contributor
None of these images are appearing for me. They are in your previous post though. Hosting bandwidth issue?
The images are hosted by ASR. I will edit the post later and re-upload the images.
FIR filters are already kind of doing that during the introduced delay but I don't think ART is doing any magic at that front because they have confirmed ART will benefit from larger surround speakers to deal with the counter bass waves required for cancellations.Also in a video I am watching at the moment, Dr Ericsson of Dirac says "we cancel out the reflections and the wave just propagates through the room". Again I am wondering if they are cancelling in advance of the song, to "clean up the room" before the actual sound wave propagates?
I'm still watching this video, and later on he says;
Code:
26:19    example after having applied direct live room correction and then you take um what's it called a [Room EQ] Wizard or
26:27    [REW] and make another measurements just uh one more measurement just to see what how was the result actually by an
26:33    objective third-party measurement tool uh you may see that there are still
26:39    some you know null ish behavior in the in the base
26:45    region but but I've seen this myself
26:52    applying active room treatment and on these two speakers you get
26:57    perfectly flat response uh on on in the base region so really getting rid of the
27:05    um yeah the null type of behavior
So he said a bit earlier in the video that DLRC uses phase correction and he also discussed allpass filters in that context, and then he has said that REW shows room nulls after DLRC but they are fixed after DART. Presuming the same smoothing is used to not hide the nulls via a "trick", then there is definitely more at play with their method!
I'm not 100% sure what you're getting at, I'll have to read over your posts again. Perhaps you can elaborate further too? All this IR stuff is confusing the heck out of me.Indeed, so this shows in the impulse response as a kind of sharp peak at that delayed time.
To have a comb filter at n*20Hz this would mean a sharp peak in the impulse response at 50Msec!
Never seen a living room like that
But I'm pretty certain if a room were 8.7m long, an impulse peak would appear at 50ms, thus boosting 20Hz. In the mdat OCA posted earlier, an impulse is present just before 30ms, which corresponds to ~33Hz and the peak buildup he has. The impulse is ~10%. If the speakers are close to a wall in a 5m room, and the mic is 2m away from that wall, then the sound has to travel 3m past the mic to the back wall, and then 3m to return. That's 6m past the mic, which is 3x doubling of the speaker to mic distance, thus 3x-6dB of SPL, so roughly 12% at listening position. So that all seems to line up correctly?

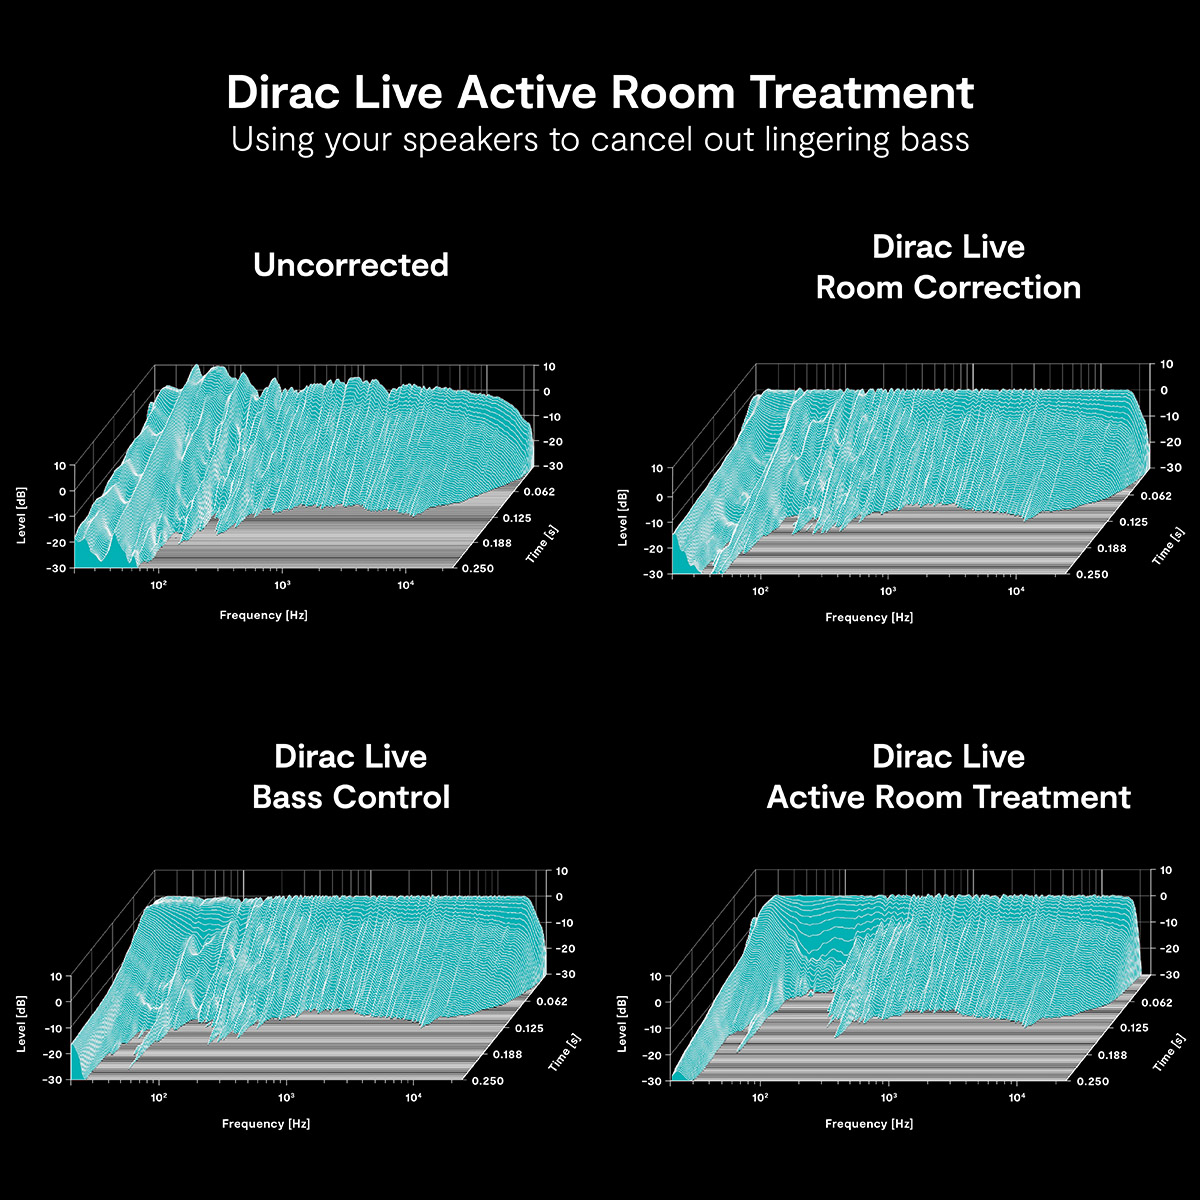
These waterfall graphs show very little improvement over DLBC which merely applies one or two time reversed allpass filters to reverberating frequencies. And this is probably one of their best results:I'm still watching this video, and later on he says;
Code:26:19 example after having applied direct live room correction and then you take um what's it called a [Room EQ] Wizard or 26:27 [REW] and make another measurements just uh one more measurement just to see what how was the result actually by an 26:33 objective third-party measurement tool uh you may see that there are still 26:39 some you know null ish behavior in the in the base 26:45 region but but I've seen this myself 26:52 applying active room treatment and on these two speakers you get 26:57 perfectly flat response uh on on in the base region so really getting rid of the 27:05 um yeah the null type of behavior
So he said a bit earlier in the video that DLRC uses phase correction and he also discussed allpass filters in that context, and then he has said that REW shows room nulls after DLRC but they are fixed after DART. Presuming the same smoothing is used to not hide the nulls via a "trick", then there is definitely more at play with their method!
I'm not 100% sure what you're getting at, I'll have to read over your posts again. Perhaps you can elaborate further too? All this IR stuff is confusing the heck out of me.
But I'm pretty certain if a room were 8.7m long, an impulse peak would appear at 50ms, thus boosting 20Hz. In the mdat OCA posted earlier, an impulse is present just before 30ms, which corresponds to ~33Hz and the peak buildup he has. The impulse is ~10%. If the speakers are close to a wall in a 5m room, and the mic is 2m away from that wall, then the sound has to travel 3m past the mic to the back wall, and then 3m to return. That's 6m past the mic, which is 3x doubling of the speaker to mic distance, thus 3x-6dB of SPL, so roughly 12% at listening position. So that all seems to line up correctly?
View attachment 302770
And here they mention "feed forward" and surround speakers:
Funny that they claim it "cannot be equaled through manual approaches". They should then reveal their already patented technique since noone can approach it manually
I will go ahead and claim that I can beat Dirac correction every time at every room. For an automated method to not falsely read IR start times, avoid pre/post ringing and/or possible speaker/ear damage claims, etc. the margins are kept so low that there's no way it can come close to what can manually be done. I wonder how much advantage would they be left with if the multichannel receiver manufacturers opened their FIR engines to manual input instead of intentionally keeping it under strict monopoly of Audyssey and Dirac.
It's mostly a marketing gimmick IMO.
Last edited:
Where did you get these graphs from?These waterfall graphs show very little improvement: over DLBC which merely applies one or two time reversed allpass filters to reverberating frequencies.
And here they mention "feed forward" and surround speakers:
View attachment 302772
Funny that they claim it "cannot be equaled through manual approaches". They should then reveal their already patented technique since noone can approach it manually
I will go ahead and claim that I can beat Dirac correction every time at every room. For an automated method to not falsely read IR start times, avoid pre/post ringing and/or possible speaker/ear damage claims, etc. the margins are kept so low that there's no way it can come close to what can manually be done.
It's mostly a marketing gimmick IMO.
And I think DL-ART does show a pretty major improvement. DL-BC has over 100ms below 100Hz, whereas DL-ART has much less than 62ms, maybe more like 50ms. And both a far superior to DL-RC for handling 40-50Hz region.
We see lots of terms that DIRAC introduced, and these are not common ground to the science behind this obscure technology. I'm pretty much convinced that there is nothing revolutionary about it, nor even something to be patented (in Europe).
What DIRAC does is to display the end result as to promote their product. Fair enough, but as far as I see there's no in depth (math/) explanation, and also no comparison to just using proper individual notch filters.
One other word of caution: don't do that with your mains' signal. Reason should be obvious.
Keith_W
Major Contributor
Uli is not generating the minimum phase version of the VBA filter. That totally removes extra group delay introduced by VBA.
Sorry OCA this is incorrect. He is using minimum phase. I realize that my post is quite information dense and you may have missed it, but here it is in Point #3:
3. Create the filter. Here, we are only correcting to 150Hz.
- Generate-Crossover. Butterworth, 150Hz, 4th order. Load XO1L and XO2L into curves 1 and 2.
- Then apply to XO1L and XO1R TD Functions-Phase Extraction. Minphase, start 20, end 400 into Curve 3 and 4.
I'm still focussing on the IR side of things because I don't understand;
Then in Audacity I created a 1 cycle tone of 33.7Hz, duplicated it, and convolved each of the 3 IR's individually. The results are extremely similar, which confirms the "correctness" of testing the IR in this method IMO. Also because back in REW on the bandpassed measurement/IR, I noticed it looks basically the same! You can see all this in the following screenshot;

Now back in REW I tick on the "Envelope (ETC)" plot and adjsut the scale to see this (it's the same IR as the previous screenshot), which presumably relates to what is seen on the Spectrogram;

Next I was fiddling around in the "Filtered IR" tab with the original measurement/IR and applied a 50Hz filter, getting a good result. I then went to the normal "Impulse" tab, and it looked about the same;


I haven't read up on what the "ETC" or "Schroeder Integral" technically mean yet, but based upon what I'm seeing I think the ETC is the SPL at each moment and is the same thing as seen on the spectrogram. The Schro-Int on the other hand I'm not sure, because on the Filtered-IR plot it kind of looks like an "effectiveness over time" measure of all the sound that is measured and will be heard. Which kind of suggests that the sound at 90ms is too loud? And the dip at ~150ms "delays" the sound (smears it in time). But now that I look at the same frequency on the RT60 decay screen, I wonder if the Schro-Int is not a room/measurement specific plot, but a frequency dependent one? On the RT60 decay it looks like if the plot goes above the line its louder than necessary for clean sound at that point in time? Because the dip at 60Hz is sort of there, and the peak at 80Hz seems to relate to the main on at 90Hz (maybe again an "effectiveness" measure?)

Because going to the spectrogram now shows similar features at 50Hz. Not at exactly the same times (which seems odd), but it does seem to be within the same cycle. I mentioned the "oddity" with of the "peak energy" line jumping around on the spectrogram, but it didn't seem to relate properly (directly) with the RT60 decay plot. It does however relate pretty well to the filtered IR plots. You can definitely see the initial pressure max before 50ms, followed by the dip between 50-100ms, then the new max after that. The spectrogram seems to follow the Schro-Int.

I've done this analysis because the VBA impulse method people have been doing so far can only do 1 cycle delay, but is it the first cycle that you want to target? Maybe on the 33Hz plot is only the 3rd cycle + that wants attention? On the 50Hz plot, it might be more tricky. Whatever is causing the dip on the buildup might need fixing? Perhaps it is a reflection and appears again on the down slope. But the big depression and build up again, I don't know. Is the response meant to follow the green line more closely?

Edit: I had the thought whilst writing this to take the 1 cycle tone in Audacity, apply the VBA IR, then apply the in room IR. So I just did this. I'll tell you what, it did more than I expected! It certainly squashed the first in room peaks (ref lines #1 and #2), and delayed some subsequent strong peaks (#3 and #4). So yer, maybe there is some cancellation in effect, but also considering what I posted above, it also seems like the "peak" is substantially delayed now.

I wonder now if applying VBA IR to the measured IR in REW looks the same? Or does applying the VBA IR to the measured IR not work because the order is backwards?
- how direct and indirect sounds accumulate at our listening position and thus define our perception of the volume,
- how additional out of phase sounds affect that perception,
- critically: how REW handles/plots that info.
Then in Audacity I created a 1 cycle tone of 33.7Hz, duplicated it, and convolved each of the 3 IR's individually. The results are extremely similar, which confirms the "correctness" of testing the IR in this method IMO. Also because back in REW on the bandpassed measurement/IR, I noticed it looks basically the same! You can see all this in the following screenshot;
Now back in REW I tick on the "Envelope (ETC)" plot and adjsut the scale to see this (it's the same IR as the previous screenshot), which presumably relates to what is seen on the Spectrogram;
Next I was fiddling around in the "Filtered IR" tab with the original measurement/IR and applied a 50Hz filter, getting a good result. I then went to the normal "Impulse" tab, and it looked about the same;
I haven't read up on what the "ETC" or "Schroeder Integral" technically mean yet, but based upon what I'm seeing I think the ETC is the SPL at each moment and is the same thing as seen on the spectrogram. The Schro-Int on the other hand I'm not sure, because on the Filtered-IR plot it kind of looks like an "effectiveness over time" measure of all the sound that is measured and will be heard. Which kind of suggests that the sound at 90ms is too loud? And the dip at ~150ms "delays" the sound (smears it in time). But now that I look at the same frequency on the RT60 decay screen, I wonder if the Schro-Int is not a room/measurement specific plot, but a frequency dependent one? On the RT60 decay it looks like if the plot goes above the line its louder than necessary for clean sound at that point in time? Because the dip at 60Hz is sort of there, and the peak at 80Hz seems to relate to the main on at 90Hz (maybe again an "effectiveness" measure?)
Because going to the spectrogram now shows similar features at 50Hz. Not at exactly the same times (which seems odd), but it does seem to be within the same cycle. I mentioned the "oddity" with of the "peak energy" line jumping around on the spectrogram, but it didn't seem to relate properly (directly) with the RT60 decay plot. It does however relate pretty well to the filtered IR plots. You can definitely see the initial pressure max before 50ms, followed by the dip between 50-100ms, then the new max after that. The spectrogram seems to follow the Schro-Int.
I've done this analysis because the VBA impulse method people have been doing so far can only do 1 cycle delay, but is it the first cycle that you want to target? Maybe on the 33Hz plot is only the 3rd cycle + that wants attention? On the 50Hz plot, it might be more tricky. Whatever is causing the dip on the buildup might need fixing? Perhaps it is a reflection and appears again on the down slope. But the big depression and build up again, I don't know. Is the response meant to follow the green line more closely?
Edit: I had the thought whilst writing this to take the 1 cycle tone in Audacity, apply the VBA IR, then apply the in room IR. So I just did this. I'll tell you what, it did more than I expected! It certainly squashed the first in room peaks (ref lines #1 and #2), and delayed some subsequent strong peaks (#3 and #4). So yer, maybe there is some cancellation in effect, but also considering what I posted above, it also seems like the "peak" is substantially delayed now.
I wonder now if applying VBA IR to the measured IR in REW looks the same? Or does applying the VBA IR to the measured IR not work because the order is backwards?
Last edited:
Here's something else I just did. I wondered what the influence of the back wall reflection was? So I zoomed in on the impulse screen and selected 0dB point just left of the ~29ms impulse. Then I pushed "set t=0 at cursor" and set up the IR Windows settings as follows;

Now it needs time after to measure all those frequencies, which means it includes all sorts of late relfections, but at least the earliest and strongest reflections are gone. So here is what the SPL screen looks like with this IR window applied;


I need to study this in more detail (and compare to the original to see if it differs), but it does show that the nulls appear on the group delay plot;

Now it needs time after to measure all those frequencies, which means it includes all sorts of late relfections, but at least the earliest and strongest reflections are gone. So here is what the SPL screen looks like with this IR window applied;
I need to study this in more detail (and compare to the original to see if it differs), but it does show that the nulls appear on the group delay plot;
Keith_W
Major Contributor
Today I spent a bit more time trying to refine the VBA. With VBA, there are two major variables that have to align for it to work:
1. The amount of delay. This is calculated from room size (as mentioned in previous posts)
2. The amount of attenuation.
So today I spent some time trying to find the correct delay. I generated four filters with different assumptions (and therefore different delays):
- VBA1: Measured sub delay + 7m room length. However, the measured sub delay is suspiciously long, 630 samples = 13ms of delay, or 4.5m distance. The subs are only 1.5m behind the main speakers.
- VBA2: Assuming that the above sub delay is incorrect, I took the first negative deflection as the peak (assuming the possibility that the polarity of the sub could be inverted). This gave 300 samples, or 6.5ms of delay, or distance of 2.2m. Seems more realistic.
- VBA3: The room might be 7m long, but the subs are pushed about 1m into the room. So this filter assumes that the sub has 6.5ms of delay, and the room is 6m long.
- VBA4: Sub delay not accounted for at all, and room length assumed to be 7m.
Outcome: of all the filters, VBA3 was the clear winner. It produced the flattest frequency response, and evened out the bass at other listening positions. The message seems clear to me: when calculating the delay, the distance that should be accounted for is not the length of the room, but the length from the subwoofer to the rear wall, multiplied by 2.
So let's take a closer look at VBA3.

Comparing the VBA3 filter to the uncorrected room response, we can see that it is a relatively good match. There are peaks in the filter where there are dips in the room response, and vice-versa (not everywhere though!). Given that bass frequencies and the filter are both minimal phase systems, just looking at this comparison should help us predict where the peaks and dips will be after correction.

So let us take a look at the measured response. This is a comparison of the control (no VBA, overall room EQ only), the measured room response of VBA3, and the VBA3 filter. It should be apparent that the outcome is not perfect. The VBA3 filter produces a more lumpy response at the main listening position (MLP), corresponding to dips in the filter at 50Hz and 80Hz.

However, if we move to the left sofa, we can see that all the other filters fail to produce an even bass response ... except VBA3. So clearly VBA3 is working as intended - the bass response is more even in the listening room and not only in the MLP.
I confirmed this with subjective listening. VBA3 gives a noticeably smoother bass tone and variation in bass tone around the room is much less lumpy than the control.
Now that I know roughly which calculation I should be using to generate the delay, the next step is to really hone in on calculating the correct delay by applying several other assumptions to the calculation and measuring to see which gives the best response. Most notably, I have dipole subs and the rough calculation is from the centre of the sub. Obviously the rear facing subwoofer is going to radiate towards the front wall, bounce back, and travel the length of the room and back again so there is scope for additional refinements to the filter.
I also measured a waterfall with REW. Every VBA iteration worsened the waterfall. I am not worried, because this tells me that the attenuation has not been correctly set. If the cancellation signal is too high in amplitude, and with the delay incorrect, it contributes to ringing instead of removing it.
CONCLUSION FOR THE DAY
When Uli wrote his instructions for calculating room distance for a VBA, he said this:
I have bold typed the part that I missed the first time I read it - or at least, I did not realize its significance. In his instructions, Uli tells you to double the room length to obtain the transition time, and then subtract the measured delay of the subwoofer. This assumes that the speaker is flush against the wall.
My experiments today have demonstrated that the actual distance that should be calculated is the distance from the subwoofer to the rear wall and back and not the length of the room. Uli does say this, but I think most casual readers will miss its significance.
Most importantly, my experiments have demonstrated that the calculation works. My next iteration will take into account the fact that I have push-pull subs, with one driver firing forwards into the room, and the other firing rearwards into the front wall, reflecting down the length of the room, and then back. After this, I will work on finding the correct attenuation for the filter.
1. The amount of delay. This is calculated from room size (as mentioned in previous posts)
2. The amount of attenuation.
So today I spent some time trying to find the correct delay. I generated four filters with different assumptions (and therefore different delays):
- VBA1: Measured sub delay + 7m room length. However, the measured sub delay is suspiciously long, 630 samples = 13ms of delay, or 4.5m distance. The subs are only 1.5m behind the main speakers.
- VBA2: Assuming that the above sub delay is incorrect, I took the first negative deflection as the peak (assuming the possibility that the polarity of the sub could be inverted). This gave 300 samples, or 6.5ms of delay, or distance of 2.2m. Seems more realistic.
- VBA3: The room might be 7m long, but the subs are pushed about 1m into the room. So this filter assumes that the sub has 6.5ms of delay, and the room is 6m long.
- VBA4: Sub delay not accounted for at all, and room length assumed to be 7m.
Outcome: of all the filters, VBA3 was the clear winner. It produced the flattest frequency response, and evened out the bass at other listening positions. The message seems clear to me: when calculating the delay, the distance that should be accounted for is not the length of the room, but the length from the subwoofer to the rear wall, multiplied by 2.
So let's take a closer look at VBA3.
Comparing the VBA3 filter to the uncorrected room response, we can see that it is a relatively good match. There are peaks in the filter where there are dips in the room response, and vice-versa (not everywhere though!). Given that bass frequencies and the filter are both minimal phase systems, just looking at this comparison should help us predict where the peaks and dips will be after correction.
So let us take a look at the measured response. This is a comparison of the control (no VBA, overall room EQ only), the measured room response of VBA3, and the VBA3 filter. It should be apparent that the outcome is not perfect. The VBA3 filter produces a more lumpy response at the main listening position (MLP), corresponding to dips in the filter at 50Hz and 80Hz.
However, if we move to the left sofa, we can see that all the other filters fail to produce an even bass response ... except VBA3. So clearly VBA3 is working as intended - the bass response is more even in the listening room and not only in the MLP.
I confirmed this with subjective listening. VBA3 gives a noticeably smoother bass tone and variation in bass tone around the room is much less lumpy than the control.
Now that I know roughly which calculation I should be using to generate the delay, the next step is to really hone in on calculating the correct delay by applying several other assumptions to the calculation and measuring to see which gives the best response. Most notably, I have dipole subs and the rough calculation is from the centre of the sub. Obviously the rear facing subwoofer is going to radiate towards the front wall, bounce back, and travel the length of the room and back again so there is scope for additional refinements to the filter.
I also measured a waterfall with REW. Every VBA iteration worsened the waterfall. I am not worried, because this tells me that the attenuation has not been correctly set. If the cancellation signal is too high in amplitude, and with the delay incorrect, it contributes to ringing instead of removing it.
CONCLUSION FOR THE DAY
When Uli wrote his instructions for calculating room distance for a VBA, he said this:
Dr. Uli Brueggemann said:A speaker is positioned at the frontwall with zero distance. It sends a perfect Dirac signal. The soundwave moves to the back wall (behind a listener, the listener is not discussed here) and is reflected there. Some energy is lost, thus the reflection level is reduced by a factor x. Now the reflectied soundwave moves to the front wall and is also reflected there with some enery loss by a factor x.
So we get an echo after a time t = 2 * room length(speed of sound. The echo can be considered as a new played sound by the speaker. The next echo cycle starts.
I have bold typed the part that I missed the first time I read it - or at least, I did not realize its significance. In his instructions, Uli tells you to double the room length to obtain the transition time, and then subtract the measured delay of the subwoofer. This assumes that the speaker is flush against the wall.
My experiments today have demonstrated that the actual distance that should be calculated is the distance from the subwoofer to the rear wall and back and not the length of the room. Uli does say this, but I think most casual readers will miss its significance.
Most importantly, my experiments have demonstrated that the calculation works. My next iteration will take into account the fact that I have push-pull subs, with one driver firing forwards into the room, and the other firing rearwards into the front wall, reflecting down the length of the room, and then back. After this, I will work on finding the correct attenuation for the filter.
This is what I noticed in my last Audacity screenshot = that the strongest cycles are delayed by 1 to 2 cycles from where they would have been. I am really wondering if the way to go is in advance, not delay!Every VBA iteration worsened the waterfall.
Can you export your IR's and test them like I did (the in room measurement with any basic EQ applied, and the VBA's)? If you upload them here I will do it.
Your control measurement must already have EQ applied, because how else did that huge trough between 30 and 45Hz get filled?So let us take a look at the measured response. This is a comparison of the control (no VBA, overall room EQ only), the measured room response of VBA3, and the VBA3 filter.
How do the cones move relative to each other though? If both move in or out at the same time, and if their distance apart is less than 1/4 of the relevant wavelength, then I believe their output effectively sums. Here's at least 1 comment that says as much.My next iteration will take into account the fact that I have push-pull subs, with one driver firing forwards into the room, and the other firing rearwards into the front wall
Okey, you're all doing your stuff. But, admittedly you lost me. I would rather like to see a discussion of this topic in more common terms. As I alread pointed out, mentioning my experience with an evil 6th order bandpass, what about steady state frequency response, all reverberation included for bass, and just and only group delay?This is ...
Not waterfall plots and the like. The latter only distracts from the basic facts, as they tend to attract wild interpretations, while not being anything else than just that: amplitude and group delay, but in fancy colors.
cu
I disagree because I don't know if (or how) the SPL graph is capable of showing these "over time" effects properly? All my previous analysis posts have been working towards understanding this fundamental question I have. Let me break it down;Not waterfall plots and the like. The latter only distracts from the basic facts, as they tend to attract wild interpretations, while not being anything else than just that: amplitude and group delay, but in fancy colors.
Say I send a 1 cycle tone out of 1 speaker, I will first hear/experience it's full effect (the direct sound). Then I will start hearing the 1st reflections. Meanwhile the direct wave has carried on and is now at the back wall, so now is the time for a cancellation wave to be output, so I can cancel the back wave before it get backs to me...
This is where I'm not certain what happens, because the way everyone is trying to do VBA in this thread implies merging the cancellation tone in to the normal signal and outputting it from the same speaker. A 33Hz tone is 30.3ms longs and is the first "boosting" room mode in a ~5m long room. But the tone has only travelled ~5m to back wall, which only takes 14.6ms max! (1000ms / speed of sound 343m/sec * 5m) So the speaker is only half way through playing the 1 cycle 33Hz tone when you now want it to output a cancellation tone too?! Well doesn't this just mean the speaker will output a phase shifted and attenuated signal (= the comb filter effect you mentioned, which does seem to be the technical term for the effect). It just doesn't seem possible for it to be effective to me!
But instead, lets say you have a second speaker like Dirac ART is "doing" (the left cancels the rights reflections, and vice versa). And lets presume the source song or whatever doesn't have "mono bass" (thus no comb filtering on the signal side), and thus the 2nd can properly cancel the 1st. This means the 2nd speaker will output a (presumably) delayed and inverted signal at the particular frequency, and on its way to me it will "comb filter" with all the reflections that are already on their way to me (from the 1st speaker), doing who knows what? Then the cancellation wave will pass by me, so I will "experience it" (hear it). Then it is meant to cancel the OG back wave that has by now almost arrived at me, so hopefully I hear nothing.
Hopefully this graphic will further explain what I've just explained/queried.

Because here's the thing (I think) about the SPL graph in REW - it interprets time in a certain way, and gives "1 answer". But I showed in a previous post a "VBA" (delayed+filtered impulse), and how that looked the same as 2 PEQ's (the first a +dB wide Q filter, the other a -dB narrow Q filter). At the frequency I was looking at (the ~33Hz room mode) the "SPL Graph" looked the same. But if the sound pressure "experienced" is completely different, then how can the SPL graph look the same? This is what I am questioning, and I think there is a deficiency caused by only looking at the SPL graph.
Here's what I'm saying in a different way: 2+2=4, but also 3+1=4. Are these the same?
Edit: Just to emphasise this point: why not 1+3=4 too? To me, 2+2 is akin to a normal room. Other early/late combo's involving 3&1 are surely different rooms. But if they look the same in REW SPL, what does that mean? And this is why I was looking at continuous tones vs "burst tones" (1 cycle is all I've got to). If REW only measures "1 cycle", how does it compare an in room IR of 2+2 vs 3+1 vs 1+3?
Also, taking a step back, VBA was trying to copy the benefits of double bass array. I haven't experienced or seen REW/impulse results from DBA, but thinking about it like I have above, the main "wave" passes by, and that's what you hear. I imagine the wave would predominately be direct sound, because "reflections" will come after it, but the symetrical arrangement of a DBA/SBA means the reflections cancel before arrival. And when the wave gets to the back wall, the back wall subwoofers output a perfect cancellation wave. This means there is NO returning wave, and thus you should only hear the direct sound?! I wonder how this would look on my previous graphic? Maybe like this;

Last edited:
Keith_W
Major Contributor
This is what I noticed in my last Audacity screenshot = that the strongest cycles are delayed by 1 to 2 cycles from where they would have been. I am really wondering if the way to go is in advance, not delay!
Can you export your IR's and test them like I did (the in room measurement with any basic EQ applied, and the VBA's)? If you upload them here I will do it.
It appears that Uli himself is watching this thread now. I got this message from him:
Dr. Uli Brueggemann said:imagine a room of length 6m length. The speakers are positioned 1 m before the front wall. The listener is located 2 m before the back wall.
Ok, the speasker plays and the first sound wave reaches the listener after 3 m travel. Then the sound moves 2 m further (5m total) before it gets reflected by the back wall.
Now the sound is traveling back reaching the listener after 2 m and the speakers after 5 m. At this point the sound has travelled 10 m and we may think about playing at this point an inverse signal.
Now the sound reaches the front wall after 6m, get6s reflected and will pass the speakers after 1m travel. So from the beginning the sound now has travelled 12 m and it moves in the same forward direction to the listener as the first wave.
This means that we may think about 10 travel or 12 m travel distance. Anyway the 12m distance is independent of speaker and listener position.
Another problem gets into the game: we have furniture in the room influencing the dimensions.
And another problem: the sound is not a beam, especially low frequencies a radiating in a sphere. So in our reflection game the sound wave after 12m has another dimension than the opposite wave played as VBA signal.
So there are many influences in the game and thus the reality is more complex than the simple approaches.
Now I am not so stupid as to disagree with the author of the software I am using and a noted and respected figure in the DSP community. But I feel that attempting to model too many reflections at once will make verification measurements very difficult to interpret. So what I am going to do is model only the first reflection, make sure the verification sweeps look OK, and then tackle the second reflection. And maybe the third.
Your control measurement must already have EQ applied, because how else did that huge trough between 30 and 45Hz get filled?
Yes, that is correct. I have two control measurements - the first is the raw uncorrected response (I have shown a couple of graphs with this), and the EQ'ed corrected response. The purpose of the EQ'ed response is to see whether the VBA outperforms EQ. At the moment, it does not.
How do the cones move relative to each other though? If both move in or out at the same time, and if their distance apart is less than 1/4 of the relevant wavelength, then I believe their output effectively sums. Here's at least 1 comment that says as much.
They move in and out at the same time. The depth of the box is 65cm, which is a quarter wavelength of 2.6m, which corresponds to 132Hz. I believe you may be correct, thank you for pointing that out.
Similar threads
- Replies
- 10
- Views
- 2K
- Replies
- 5
- Views
- 849
- Replies
- 13
- Views
- 900
- Replies
- 1
- Views
- 623