
Frank you might be surprised if you did some homework on what's available in multich today.Precisly this, and this is why I have stuck with stereo rather than multi channel - my favourite recordings are stereo so all the benefits of spatial accuracy of multi channel don't apply to them
I'm not a classical person but I recently took advantage of a Berliner Philharmoniker free 7 day offer to check out the offerings.
They are streaming some amazing music from live concert events much in some awesome multich sound.
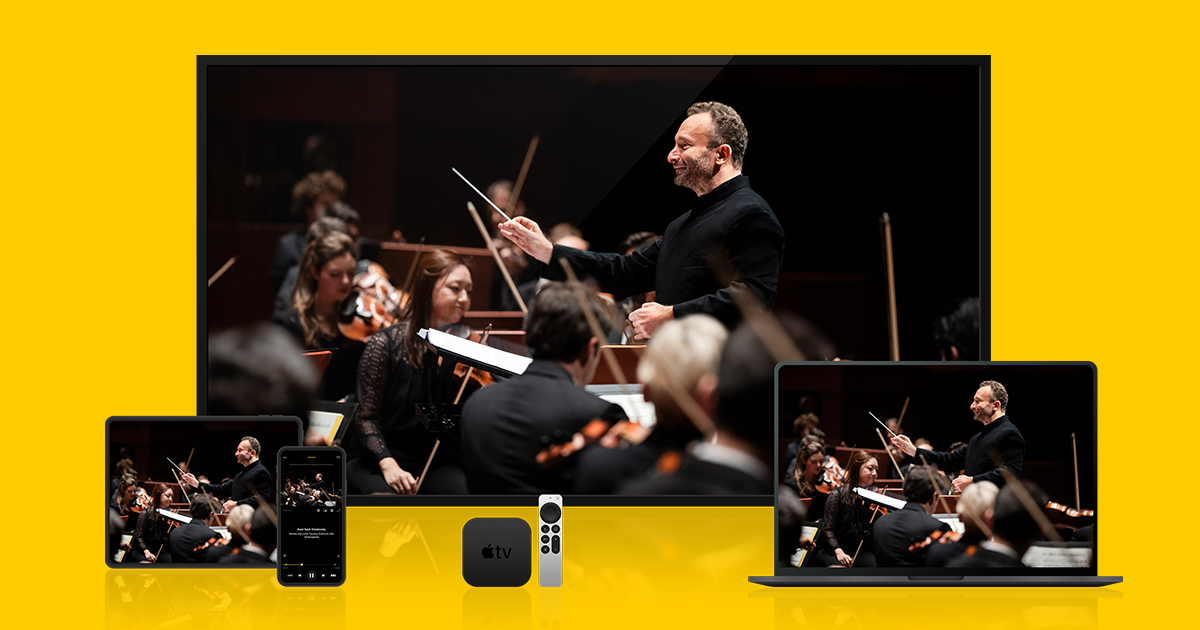
Concerts | Digital Concert Hall
The Digital Concert Hall archive contains over 700 video recordings of Berliner Philharmoniker concerts. The search categories help you find the content of your choice.
It's not a matter of money for you, expand your horizons by adding multich capability to your current system.
You won't be disappointed.
