• WANTED: Happy members who like to discuss audio and other topics related to our interest. Desire to learn and share knowledge of science required. There are many reviews of audio hardware and expert members to help answer your questions. Click here to have your audio equipment measured for free!

What am I missing about frequency charting in computer data?

maxotics

Member
Joined
Aug 8, 2023
Messages
52
Likes
4
I blow an 'A' in a pitch pipe and record it to a WAV file. I then calculate how many data points I'd need to see a full cycle 48000 / 453 (not true 'A', what AUBIO shows) = ~ 106

a_pitch_pipe.jpg


The waves look very consistent over time. I get this "wave" wherever I chart a sample of 106 points.

I then generate an A-note using SOX

sox -V -r 20050 -n -b 16 -c 1 sin440hz.wav synth 30 sin 440 vol -10dB

And I get this, which is what I expect

wav440hzfile_charted.jpg


I've tried all kinds of variations of these files, changing sampling rates, channels, etc. But same problem. How does Aubio know it's 453hz, but the wave looks like it's 880hz? Or does that data resolve, perceptually, to 440?

I must be missing something simple but I can't figure it out! THANKS for anyone's help! I attached the WAV files and their data.
 

Attachments

  • wav_files.zip
    986.1 KB · Views: 41

SSS

Senior Member
Joined
Jan 12, 2023
Messages
319
Likes
202
Location
Germany
I am not sure what you want to acomplish with this test. But the file a_pitch.wav is distorted and not a clean 440 Hz sine. So the software might detect higher frequency components and calculated these. If not then the software may be buggy.
 

DVDdoug

Major Contributor
Joined
May 27, 2021
Messages
3,034
Likes
3,996
It will probably average-out over multiple cycles. The harmonics & overtones mean that every cycle is not the same and the time between zero-crossings is not the same for every "cycle".

Usually "pitch" is measured with FFT or other "frequency analysis" where the waveform is broken down into its frequency components. In FFT, the fundamental and harmonics will "stand out". With some instruments and some notes, the 1st harmonic is stronger than the fundamental.

The pitch pipe won't be as "perfect" as the digitally generated wave but I don't know how much variation-error is normal...

P.S.
There can also be errors in the recording or playback hardware. It's not unusual for musicians to end-up with out-of-tune recordings when using a "consumer soundcard". Sometimes they will record with a USB mic (or USB interface) and when they play back on their soundcard it's off-pitch. Or a singer might be singing in-tune to a backing-track from the soundcard while recording with a USB mic. If the clock/oscillators (the clocks that generate the sample rate) in the two devices don't match, the singing will be out-of-tune when mixed.
 
Last edited:

SSS

Senior Member
Joined
Jan 12, 2023
Messages
319
Likes
202
Location
Germany
Hm, basically right. So you mean the variation of time between zero crossings? Myself I am not specialized in software FFT how it will analyze the signal. So I have no further clue. Analog spectrum analysis is done with narrowband filters.
 
OP
M

maxotics

Member
Joined
Aug 8, 2023
Messages
52
Likes
4
My naïve expectation is that yes, the "wave" will look choppy. When I blow into the pitch pipe it is obviously wonky. But I don't expect two seemingly well formed cycles for each 440 data points. Or, if one wave was significantly larger than the other I'd chalk it up to harmonics--though that may end up being the case! I'm going to go download an 'A' played from a piano, pull the data from that, chart it, and see what we'll see!
 
OP
M

maxotics

Member
Joined
Aug 8, 2023
Messages
52
Likes
4
What kind of filtering? Do you mean a kind of rolling average to match closer to what we psychoacoustical resolve? Thanks! I did the same to a recorded piano note it also charted what looks like 2 cycles.

a_note_piano.jpg


I averaged each number by the trailing 50 and it starts to look a lot better!

a_note_piano_moving_average50.jpg
 
Last edited:

neRok

Senior Member
Joined
Oct 7, 2022
Messages
304
Likes
175
Location
Australia
I blow an 'A' in a pitch pipe and record it to a WAV file. I then calculate how many data points I'd need to see a full cycle 48000 / 453 (not true 'A', what AUBIO shows) = ~ 106

View attachment 304551

The waves look very consistent over time. I get this "wave" wherever I chart a sample of 106 points.

I then generate an A-note using SOX

sox -V -r 20050 -n -b 16 -c 1 sin440hz.wav synth 30 sin 440 vol -10dB

And I get this, which is what I expect

View attachment 304552

I've tried all kinds of variations of these files, changing sampling rates, channels, etc. But same problem. How does Aubio know it's 453hz, but the wave looks like it's 880hz? Or does that data resolve, perceptually, to 440?

I must be missing something simple but I can't figure it out! THANKS for anyone's help! I attached the WAV files and their data.
I've been dabbling with convolving IR's and stuff in Audacity lately, and so this is AFAIK (I'm not an expert and still learning), but I think you're just looking at a recording that has captured a lot more than 440Hz. All those captured noises get added in to the wave (convolved), and so the result ends up looking like your 1st image. You can look at the recording with Spectrogram plot to reveal the power of different frequencies captured. Also you can bandpass the recording around the target frequency to see how much of the target frequency is captured. I'm new to bandpassing, but 1/3 octave away with 48dB slopes seems to not affect the target SPL at the target frequency (so for 440Hz that's 366HP and 587LP). However, such steep slopes seem to add a delay to the data, so lower slopes might be better in that regard. But anyway, I've done all this in the following screenshot for you, along with a separate HP and LP plot above and below the bandpass.
440.png
 
OP
M

maxotics

Member
Joined
Aug 8, 2023
Messages
52
Likes
4
Thank you fellow dabbler ;) Interesting chart!!! I understand how musical notes have harmonics. I used to watch how the E string on the guitar would wobble at different lengths when I plucked a harmonic. But I expected the chief wave, 440hz, to completely overshadow the others. As you point out, it doesn't if you graph the raw data. One of my end goals is detecting the pitch pipe in an externa audio recording and using it to synchronize it with a video. I figured it would be easy because the data would clearly group along a wave. I understand one can use various types of Fourier analysis to get at the waves, but again, wanted to work with the data directly. What would be the simplest (computer) algorithm to detect a messy pitch tone in an audio file. That's my next questions. Thanks again for the chart!!!
 

RayDunzl

Grand Contributor
Central Scrutinizer
Joined
Mar 9, 2016
Messages
13,250
Likes
17,199
Location
Riverview FL
I blow an 'A' in a pitch pipe and record it to a WAV file. I then calculate how many data points I'd need to see a full cycle 48000 / 453 (not true 'A', what AUBIO shows) = ~ 106

View attachment 304551

The waves look very consistent over time. I get this "wave" wherever I chart a sample of 106 points.

I then generate an A-note using SOX

sox -V -r 20050 -n -b 16 -c 1 sin440hz.wav synth 30 sin 440 vol -10dB

And I get this, which is what I expect

View attachment 304552

I've tried all kinds of variations of these files, changing sampling rates, channels, etc. But same problem. How does Aubio know it's 453hz, but the wave looks like it's 880hz? Or does that data resolve, perceptually, to 440?

I must be missing something simple but I can't figure it out! THANKS for anyone's help! I attached the WAV files and their data.

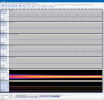
"I must be missing something simple but I can't figure it out!"


Harmonic content.


Try blowing across a bottle.

Very low harmonic content.

Grolsch 330ml beer bottle picked up by UMIK-1

index.php


Don't have an empty Grolsch 33ml bottle handy roday,, but here's something similar:

A small plastic bottle, about the size of a beer bottle. Here's the waveform:

1691678975150.png


Basically, one resonant frequency in the bottle excited by the breath.


Analyzed in REW's RTA:

1691679214839.png


---


Genuine CheapAzz Pitch Pipe playing an "A", an octave below yours:

Wow.

Harmonic City...

1691679477684.png


Waveform:

1691679616587.png
 
Last edited:
OP
M

maxotics

Member
Joined
Aug 8, 2023
Messages
52
Likes
4
Hi @RayDunzl AWESOME, AWESOME TIP!!! THANKS! I guess I wasted $3.99 on that pitch pipe ;) What videographer doesn't have a water bottle handy!
 

RayDunzl

Grand Contributor
Central Scrutinizer
Joined
Mar 9, 2016
Messages
13,250
Likes
17,199
Location
Riverview FL
Not wasted if you need the pitches handy.

Here's a trombone wave:

1691680790707.png
 
Top Bottom