I typically see the Harman target curve represented as a thin line on an amplitude vs. freq chart, as if the goal were to achieve that target precisely.
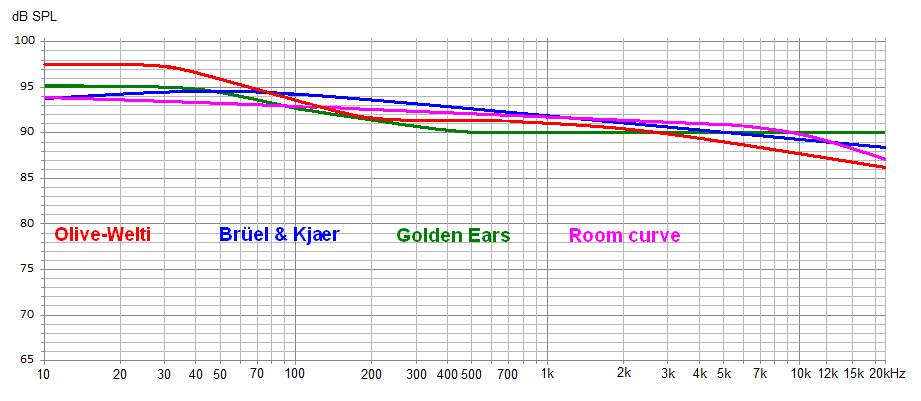
But looking at a review article written by Toole entitled "The Measurement and Calibration of Sound Reproducing Systems" (JAES 2015;63:512-541), the preferred "target" is actually depicted as not one, but a series of target curves that account for differences in: a) listener preference (okay, "experience"), and b) room reflectivity. It's not a single thin line. In fact, for the predicted steady-state curve that represents how highly rated loudspeakers measure in a typical room, there is still a region of variability/uncertainty, represented by the shaded region below.
All in all, it doesn't make sense to me to boil all of this information down into a single thin curve, which is how I see the Harman target represented pretty much everywhere. Perhaps someone can enlighten me.
Last edited: