• WANTED: Happy members who like to discuss audio and other topics related to our interest. Desire to learn and share knowledge of science required. There are many reviews of audio hardware and expert members to help answer your questions. Click here to have your audio equipment measured for free!

Measurement Conditions Explanation And Chart Interpretation Of Cuckoo Studio Review

Cuckoo Studio

Member
Reviewer
Joined
Aug 13, 2022
Messages
97
Likes
878
What you are about to read is the measurement conditions explanation and chart interpretation of Cuckoo Studio Review. This will help you better understand our measurement conditions, address any doubts about our data, and assist you in better understanding the information we aim to convey through our charts.


  • 1.Measurement equipment
  • 2.Vertical frequency response graph
  • 3.Usage of compensation curve
  • 4.Harmonic distortion graph
  • 5.3D Mixing Space
  • 6.Audio comparison
  • 7.Q&A


1.Measurement equipment

This is my studio I built by myself. which includes DIY sound-absorbing panels with fiberglass insulation, bass traps, tatami-style soft flooring, and sound-absorbing ceilings (along with my less-than-proficient painting skills). We do a lot of things here, including mixing, headphone measurements and testing, speaker reviews (and outdoor measuring), as well as sound card and microphone reviews.

总和 工作室.jpg


This is our equipment for headphone measurements.

微信图片_20230618181035.jpg


We use couplers under the IEC 60318-4 standard for measurement, model E610A NO.40192 NO.40817.

微信图片_20230618181101.jpg


I found a detailed comparison of E610A and RA0045:
It has quite good data results.

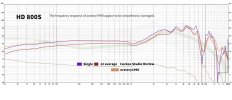
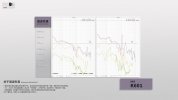
more of my own measurement data compare to the data from @crinacle and @oratory1990 . Please note that the situation is different from the one where the same headphones can be measured in the post above. Each reviewer may receive headphones with slight differences :

ARIA.jpg


DK 3001 PRO.jpg

ER4SR.jpg

IE 900.jpg

quarks.jpg


The focus now is more on "Why use the traditional 711 coupler, rather than something like the RA0401/0402 High-Frequency Ear Simulator?"
In simple terms, the RA0402 (and similarly designed artificial ears) can produce fewer "high-frequency resonance peaks generated by the coupler's own cavity" at different insertion depths, providing more stable and consistent data. However, as has been discussed in recent years (from Crinacle:https://crinacle.com/2020/04/08/graphs-101-how-to-read-headphone-measurements/)
Whether the High-Frequency Ear Simulator conforms to actual human hearing is still a big topic that requires debate and experimentation. In addition, the new standards for artificial ears have been very confusing in recent years, so I ultimately chose to use couplers like the RA0045, “711” for data measurement. With such measuring equipment, different insertion depths will cause different high-frequency peak positions. Different measurers will take different solutions, such as Crinacle choosing to unify the resonance peaks as much as possible at the 8KHz position, but also publishing data for different insertion depths due to differences in some headphone designs. For me, I will provide two sets of data for deep and shallow insertion as much as possible under the allowed conditions, so that experienced people can distinguish the high-frequency resonance peak of the artificial ear itself from the resonance peak of the headphone by comparing the two different sets of data. (And if the high-frequency resonance peak under the traditional 711 is proven to be what real humans can hear, it can also reflect the different frequency responses that different users actually hear under different insertion conditions.)


Next is the section on the pinna and support. The support was provided by the manufacturer producing E610A, and the kit also includes a pinna, which looks like this:

微信图片_20230618183108.jpg


I am not very satisfied with this pinna. The overall data obtained is quite similar, but it exhibits some shelving attenuation of 3-4dB at high frequencies. While it may match some real human ears, it is too “warm” compared to the data used in several mainstream databases such as GRAS KB5000/KB5001/KB5010. After some searching, I was recommended to purchase a pair of pinnas made by @JohnYang1997 . It is not officially available on the market (as of the completion of this article), but I was able to purchase this pair of excellent pinnas through a one-on-one arrangement, and most importantly, it is fully compatible with my rig.

微信图片_20230618182955.jpg


This is detailed comparisons of data for over-ear headphones, may include differences between different headphone samples too:

k701.jpg
K712 PRO.jpg
NDH 30.jpg


HD 800S.jpg


It seems very pleasing indeed.
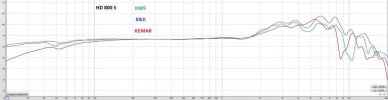
The anthropometric pinna is an area where having multiple different standards too. GRAS offers multiple models of pinnas, and other manufacturers such as B&K and HEAD acoustics have their own as well. Different reviews use different pinnas, and there are no rigid rules to unify them. Since the shape of each human ear is unique, unless there is some unethical genetic modification to standardize human ears, which sounds quite absurd, any replica of a soft auricle would represent only one particular case, and the measured data would not necessarily align with your own auditory experience. This is particularly evident in HRTF (Head-Related Transfer Function) data, especially above 8 kHz, where people’s perception of high frequencies can vary greatly. Different levels of tightness, slight shifts in position, and other factors can also result in different frequency responses, even on the same device.
Given these variable conditions, the level of conformity that JohnYang’s pinnas achieves when compared to well-known authoritative data is highly commendable and brings great pleasure.

IMG_20160217_015852-768x404.jpg
asfsa.PNG


When it comes to the results of over-ear headphones, our main focus should be on their trends and understanding the sound style of the headphones. This information is sufficient for our needs. If we want to apply compensatory EQ, it is important to note that EQ should not aim to fill all the gaps or eliminate every peak with high Q values. Instead, the goal should be to use medium or low Q values to achieve a more balanced perspective by smoothing out the overall response. For some headphones, I find that autoeq’s compensation can sound a bit strange to me. The reason is that some of the automatically generated EQ settings with high Q values are applied to areas that may undergo variations, resulting in undesired high-frequency peaks. (Using average values + smoothed frequency response data for compensation usually yields better results.) Autoeq is a great open-source project that has been immensely helpful to many people, but if possible, a gentle EQ adjustment like Amir’s tends to deliver the best effects. I have also been using a similar approach for equalizing and calibrating my headphones.

微信截图_20230618183413.png


In summary, I obtained very informative results through the E610A and JohnYang’s pinnas. Additionally, I really love this set of easily detachable artificial ear system, and I don’t think I have many reasons to replace it in the near future.


微信图片_20230618181042.jpg


Other equipment: I use the MOTU Ultralite AVB interface, with the Main Out connected to the Topping L30 headphone amplifier. I perform headphone measurements in ASIO mode at a sample rate of 48000Hz and a bit depth of 24-bit. I connect Input 6 to Output 6 for loopback to ensure consistency in frequency response during multiple sweeps. The MOTU Ultralite AVB has a naturally flat response, but I still apply compensation files to maximize its flatness. I must commend the MOTU Ultralite AVB for its powerful functionality and reliability. Previously, I used it alongside another Ultralite AVB interface to create a dolby atmos sound system using Ethernet connections. Now, with the addition of ADAT expansion for the atmos sound system, this Ultralite AVB is dedicated to performing measurements and it has proven to be more efficient than other devices in this regard.


微信图片_20230618181048.jpg


微信图片_20230618181106.jpg


You can see that I also have the Cosmos ADC and APU, along with the Topping E70 serving as a sine wave generator. With these devices, you can measure a majority of ADC/DAC equipments. (The Topping PA5 is used as a power amplifier for passive speakers. I haven’t received any sponsorship or gifts from Topping, These devices were purchased by my own. In fact, prior to this post, JohnYang and I have only had a limited amount of dialogue, and he is unaware of my ownership of any Topping devices. Purchasing devices with excellent specifications is worthwhile because it allows you to obtain good data, plain and simple.)

Additionally, I have a compensated Type 4958A omnidirectional measurement microphone, paired with a compensated and highly portable PreSonus AudioBox Go for speaker frequency response measurements. However, currently, I have no plans to publish evaluations concerning these on the ASR forum, as @amirm has already done an excellent job in this regard. Also, like L7audiolab, I have learned a lot from them.
 

Attachments

  • HD 800S.jpg
    HD 800S.jpg
    236.5 KB · Views: 81
  • rigdifference-768x198.jpg
    rigdifference-768x198.jpg
    19.9 KB · Views: 125
Last edited:
OP
Cuckoo Studio

Cuckoo Studio

Member
Reviewer
Joined
Aug 13, 2022
Messages
97
Likes
878
2.Vertical frequency response graph: Why is it flipped vertically?


BGVP NS10 freq.jpg

This image contains three important pieces of information:

① Vertical Frequency Response:

Why is the frequency response displayed vertically? When we mixing tracks, we typically perceive higher frequencies to be at a higher position. For example, when boosting frequencies above 10,000 Hz, we perceive the sensation coming from above our heads. The most powerful part of a kick drum is felt in our chest or even lower, while sub-bass frequencies are typically perceived from the bottom, as if they were emanating from the floor.
When the sound pressure level of a frequency range increases, we perceive it as being closer to us, and conversely, as it decreases, it seems further away. When combined with left-right sound imaging, this creates the vertical and horizontal fan-shaped sound fields and the perception of sound distance in stereo. This is a more specific audio demonstration that I have specifically created for this post. You can put on headphones to experience this sense of spatiality.


Therefore, in this context of psychoacoustics, interpreting the frequency response graph vertically aligns perfectly with our subjective perception of height and distance.

Due to the aforementioned variations with different pinnas, the high frequencies resonance in in-ear headphones, as well as the differences in human HRTF, I hope that people can interpret the characteristics of headphones from a more holistic perspective when examining frequency responses. Instead of becoming anxious by focusing on detailed peaks and valleys, it is important to remember that they can often be variable. Therefore, in designing this image, I intentionally reduced some of the resolution to present a broader view.
Yes, I understand that this approach may not be suitable for ASR forums where we take data seriously. Therefore, after considering everyone’s feedback, I will follow up with high-resolution images from REW in the future. This way, everyone can choose the level of detail they prefer.

EW100 LR RAW.jpg


② High-frequency hearing loss at different ages.

The Auditory Brain and Age-Related Hearing Impairment by Jos J. Eggermont cruelly illustrates the high-frequency hearing loss that occurs in the human ear with different ages. There are some other similar research data available, but many are limited to 8 kHz, while this one extends up to 16 kHz, which is great.

2f0f6867-7a5b-4668-8c63-a8cb6247ac2a.jpg


I have plotted the data on hearing loss proportionally onto the vertical frequency response graph. The extent of high-frequency loss can vary among different individuals as their age. This is just one example of experimental data, but it can serve as a somewhat typical reference. If you have a typical “adult ear,” as you age, you will be less concerned about the gain of headphones at 10 kHz because you have already started perceiving the effects of attenuation or may not hear it at all.
I have seen too many people obsess over the parts they can't hear, so through this method, people of different ages can see their own high-frequency attenuation when looking at frequency response graphs, compensating for what they actually hear. I believe this has significant reference value. At the same time, some headphones with high-frequency boost may be hell for young ears, but they may be just right for older ears. All of these can be better represented under this chart.
Below is a simple high-frequency hearing loss test. You can find similar content in many places, but in case you are curious about your own hearing at this moment, I have specially created a new one.


③ Raw&HRTF

There isn't much to explain about the raw images. As mentioned earlier, I will provide high-resolution images in future content. As for the HRTF difference map at 0 degrees, I hope to include it in every frequency response graph to remind viewers which frequency ranges do not require excessive attention to their individual measurement data.
And it is not necessary for individuals to have a perfect adherence to the Harman curve in an absolute sense. Some slight deviations can still result in a flat sound signature. As many previous reviewers have mentioned, the Harman curve can serve as a reference point, and the extracted compensation curve can provide a visual representation of the sound characteristics of each pair of headphones, making it easier for people to discern and choose the sound that suits them.

image11.png
 
Last edited:
OP
Cuckoo Studio

Cuckoo Studio

Member
Reviewer
Joined
Aug 13, 2022
Messages
97
Likes
878

3.Usage of compensation curve: Why is it OE 2018?


Regarding the use of compensation curves: We use the Harman OE 2013 without bass boost for over-ear headphones and the Harman OE 2018 with bass boost for in-ear headphones. The former is easily understandable, but why use OE for in-ear headphones?

Currently, there is a situation where many people are not satisfied with the IE 2019v2. It has added too much subjective gain in the low and high frequencies, resulting in a sound that is overly V-shaped, thick, and stimulating. However, at the same time, people always expect slightly more low frequencies in in-ear headphones based on the data. Apart from subjective preferences and the possibilities discussed by people, I have also heard an unconfirmed theory from a researcher suggesting that it may be because the low-frequency noise generated inside the ear during in-ear wearing masks some of the low frequencies of the sound, so appropriate gain can easily satisfy people. (Debate warning!)

Regardless of the reasons, it seems to be a consensus that in-ear headphones require low-frequency gain in the frequency response. However, compared to the existing Harman target curves, versions like 2013 and 2017 have either too little or too much low-frequency gain. In this case, the OE 2018 falls right in the middle. The 4dB shelving boost in the low frequencies has been well-received in my own personal use and among many people who have tried it as a compensation curve based on the 2018 version. Recently, there have been many highly praised in-ear headphones that closely match the OE 2018. The frequency response of OE is similar to IE, and in many cases, the 2018 version feels like a less extreme version of 2019v2 or 2017.

af4bb0fb-10fe-473d-8c5c-fc256c138f08.jpg


I will provide additional links to this explanation in the frequency response section so that people can quickly find answers when they have doubts. In fact, if I were to replace OE 2018 with a name like "IE XXX Target," it might eliminate some confusion. However, at least for now, I choose to respect the original data and provide some room for discussion.
 
Last edited:
OP
Cuckoo Studio

Cuckoo Studio

Member
Reviewer
Joined
Aug 13, 2022
Messages
97
Likes
878

4.Harmonic Distortion graph: From 86dB to 104dB.​


24200cf0-710b-4d4f-972d-f54e9d128536.jpg


In the distortion measurement section, I present measurements of sound pressure levels at 86dBSPL, 96dBSPL, and 104dBSPL. The 86dBSPL level represents the sound level at which most people listen to music (in fact, it is even louder than the listening volume of many people). The 96dBSPL level represents a very high volume level for listening to music, while the 104dBSPL level represents the extreme test.

In reality, the distortion produced by headphones in typical listening scenarios is likely to remain below the threshold depicted in the first chart (86dBSPL). But larger sound pressure level tests can reveal the characteristics of headphone units and internal designs under high pressure. Amir used 114dBSPL as the limit test, which is a very stringent condition and can yield very interesting results on the limits of headphones. However, I ultimately choose 104dBSPL because it is not possible for people to listen to music at 114dBSPL, and adding 6dB to that would reach the threshold of pain.


Amir uses 94dB as the starting sound pressure level for headphone measurements, which is actually very good because it is less susceptible to interference from the ambient noise in the measurement environment, and the data is usually cleaner. The disadvantage of using 86dBSPL as the starting sound pressure level is that on headphones with very low distortion, the data can be easily affected by background noise. I am in a room that has undergone decent acoustic treatment, but it has windows through which some low-frequency noise can enter. However, I believe it is meaningful to showcase distortion at normal sound pressure levels that people typically listen to. In the early stages, I used single-sweep data, but now I use REW with loopback as a timing reference for four sine wave sweeps, which provides better distortion data. Although there is still some unavoidable low-frequency background noise near 30Hz, the overall readability of distortion is quite good.

e5735bb6-6145-4e10-9bd9-9b34887692e4.jpg


I also compare the difference in distortion between the left and right sides. This can to some extent demonstrate the quality control stability of the headphones. For example, I have received some early trial versions of headphones that have not been released, and the manufacturer acknowledged that due to inexperienced assembly workers, there was a noticeable distortion peak in the data on one side. However, this characteristic may not be visually evident enough in the frequency response.

DIS K601 104DB L&R.jpg
 

Attachments

  • 002372f8-9ba9-4643-b29b-8391cbf6952c.jpg
    002372f8-9ba9-4643-b29b-8391cbf6952c.jpg
    74.7 KB · Views: 61
Last edited:
OP
Cuckoo Studio

Cuckoo Studio

Member
Reviewer
Joined
Aug 13, 2022
Messages
97
Likes
878

5.3D Mixing Space: representation of sound spatialization.


Now, finally, here we go. “Cuckoo Studio Mixing Space.” It's inspired by "The Art Of Mixing" — Created by the genius David Gibson. This is a book that comes with instructional videos.

6d98b333-46de-4cd2-be37-f98f0dc7d0dd.jpg


You can find this video on YouTube:


As one comment in the comment section said,"This is both like a vaporwave fever dream and a knowledge goldmine.” Trust me, it will blow your mind.

I have tried many, many methods to subjectively describe headphones, but later I realized that language is truly inadequate when it comes to describing sound. I thought, perhaps I could use a similar approach to relatively intuitively convey what I hear to you. Please note that I have always defined it as a subjective image, so please do not take it too seriously as any scientific model.

Here is a video demonstration:


The kick is usually larger, but for the sake of image readability, I made some adjustments. You can understand that the black part represents the bass, which also includes the booming part of the kick, but it is no longer displayed as overlapping.
This is just one of the most typical and simplest instrument spatial arrangements in modern tracks. Different styles have a wide variety of spatial arrangements. However, in this simple song, we can more easily hear the specific position of each instrument.


The vertical changes follow the same principle as the vertical frequency response mentioned earlier. High frequencies are represented at higher positions, while low frequencies are represented at lower positions. If the headphones have a roll-off or reduction in low frequencies, the bass and kick drum will appear smaller. If the high frequencies are increased, the percussion instruments represented by the light blue color above will appear larger. If a headphone has a V-shaped sound signature, you will notice some contraction in the main instruments section in the middle. If you come across some early flathead earbuds, they really lack the bass, and there may even be a roll-off in the high frequencies, just like you remember. In that case, the "vertical" space would also emphasize the mid-frequency range, while other parts would experience noticeable volume reduction.

Please refer to the video below for more details:


One point to note is that in a real live music performance, the Hihat is not suspended in the air, as everyone knows. This sensation is a product of imagination. Due to the shorter wavelength of high frequencies, they feel "lighter," while the longer wavelength of low frequencies feels "heavier," and this sensation naturally arises.

The above frequency response is simulated using a relatively simple EQ. The actual frequency response of headphones is more complex, but it mostly falls within the aforementioned sound trends.


Next is the horizontal spatial perception. This is currently not something that can be determined through scientific measurements and is limited to subjective experiences. The perception that exists in some people's minds is that in-ear headphones always have a narrow soundstage, over-ear headphones (especially open-back designs) have a wider soundstage, and speakers have an even wider soundstage compared to headphones.
This topic can lead to endless discussions, and it may even be purely illusory, similar to studies suggesting that headphones with the same sound but different appearances can create subjective auditory sound changes for some participants. (I speculate that this may also be related to the variability of headphone frequency response. For example, over-ear headphones are more likely to have different high-frequency dips between the left and right channels, while speakers can exhibit frequency response differences due to room reflections and head movements, thereby triggering the localization part of the human auditory system ... very purely subjective personal speculations.)

宽度对比.jpg


As a mixing engineer, I cannot ignore subjective auditory experiences. Despite the advancements in binaural audio algorithms for headphones in recent years, which have made such differences less pronounced, when it comes to traditional stereo sound, subjective or not, that sensation is always present.
I would be interested in hearing more speculations and discussions about the factors contributing to this phenomenon. However, for now, in terms of a rough representation in a chart, I would depict the width differences as follows: IE < OE < speakers in a well-acoustically-treated room (non-anechoic chamber).

You don't have to overly concern yourself with the details of the width. It is quite abstract to me as well and is easily influenced by frequency response. Additionally, a narrower soundstage does not necessarily imply a worse experience, as sometimes headphones can provide a more focused and immersive sound. On the other hand, speakers tend to have a slightly more diffuse sound due to crossfeed and room reflections.


Lastly, there is the ILD (Interaural Level Difference), which can be interpreted from the L+R raw image. However, extracting ILD data can make it more visually intuitive to determine if there is any channel imbalance in headphones.

3D FRONT 2023 K712 PRO.jpg

eb092e05-14ec-4757-95a8-3e7bd3b46d28.jpg


It is still being vertically aligned, as for me, viewing the measurement data of audio vertically is always more intuitive. ILD may be influenced by the position of different high-frequency peaks at different insertion depths in in-ear headphones, making it appear larger than it actually is. When processing this data, I am extra cautious. I measure data at different depths for analysis and ultimately insert it at the deepest point to obtain the L/R data at the same resonance position. This process is repeated several times until the most convincing ILD data is obtained.
Things can become more complicated with over-ear headphones. As mentioned earlier, slight adjustments in positioning and tightness of over-ear headphones can lead to changes in frequency response. Obtaining clean ILD data in such cases becomes more challenging. I try to control the wearing position on both sides as evenly as possible and minimize any leakage. This process is repeated multiple times to achieve the best possible results.


The side view of the 3D image represents the depth aspect of headphone playback. This part is influenced by the aforementioned distortions and channel imbalances. In simple terms, the larger the distortion, the heavier the coloration, and the less clean the sound. The larger the channel imbalance, the weaker the central imaging and positional sense of the sound, resulting in a more blurred stereoscopic. The greater the values of these two parameters, the more pronounced the contraction of the side view in the image.

侧面图说明.jpg


Although it is a subjective image, I have added certain calculation rules to it in post-processing. I have also optimized the calculation method in multiple versions, so that it gradually contracts the THD values only when the THD approaches 1%, which is considered the threshold of human perception. Distortions in narrow frequency bands are different from distortions across the entire frequency range, as they are less likely to be noticed. Therefore, the final calculation is an average value.
The channel imbalance is also calculated as an average across multiple frequency bands. I strive to align this image with scientific data as much as possible, but to be honest, it is not yet entirely scientific. However, this approach ensures fairness in comparing the images between different headphones, preventing it from being purely subjective to my own human ears. It also provides a certain level of reference when comparing them to each other. The same principle applies to the front view image as well. It also has a scale and follows a fixed set of calculation rules. I must emphasize once again that this image has its limitations. Please use it only as a rough reference. This is the best I can do personally to express the perceived sound to the greatest extent possible. I truly hope that someday there will be intuitive scientific models that can be calculated, allowing music to transcend the limitations of a 2D spectrum. However, for now, it seems that we are still far from achieving that.
 
Last edited:
OP
Cuckoo Studio

Cuckoo Studio

Member
Reviewer
Joined
Aug 13, 2022
Messages
97
Likes
878

6.Audio comparison listening for distortion and skew.


Let's discuss these two parameters in detail:

① Harmonic Distortion
This is a comparison of the perceived sound after adding harmonic distortion to the same track using the "subtle tape" setting in Fabfilter Saturn 2 and the “tube 2” in Analog Obsession Distox. You can see through Plugin Doctor that they primarily generate third-order and second-order harmonics, along with a smaller amount of other harmonics. This is quite similar to the distortion characteristics I have encountered in dynamic driver and balanced armature driver setups in practice.

三次谐波模拟 -25db.PNG

二次谐波模拟 -25db.PNG


I have enabled the oversampling option in two plugins to avoid audible aliasing distortion caused by the Nyquist theorem. The second and third harmonics generated by Saturn at around 90% and Distox with an input of -9.0dB are close to -25dB, which is higher than 3%.

Here is the comparison for listening:


(Uncompressed WAV file, avoiding sound compression on video platforms.)

For me, the difference in comparison between the colored and original audio at this level is very noticeable. Every time I blind test them, I can distinguish between the two. In terms of actual performance, the overall music becomes slightly more cohesive, the transients of the instruments become softer, the distance between the instruments is reduced, the originally relaxed instrument dynamics become tighter, and the overall sound becomes "dirtier."

Previous studies have shown that the impact of frequency response on headphones is far greater than that of distortion. Perhaps many people are not as sensitive to distortion. While I can discern smaller distortions, I must admit that sometimes the differences may not appear as significant in terms of parameters. I'm curious about your blind test results. Perhaps find someone to help you with random playback, or use plugins like 4U+ BlindTest (Does anyone know of a free alternative?) to give it a try. Sufficient feedback can also form a valuable social experiment. If you feel that the distortion is too significant and obvious, I can provide an updated comparison with lower distortion.

However, since this audio has not undergone any mastering coloration or loudness limiting, and has not been heavily mixed, adding this 3% saturation actually makes the audio sound "better" in a certain sense (the low-frequency part is relatively poor, but the mid-high frequency range sounds good. If it were a master, I would choose to process it in sections and filter out the low-frequency distortion). Yes, harmonic distortion is not necessarily a bad thing in some styles of mixing work. In fact, most of the time, it is necessary as it is a tool to make the sound more lush and cohesive. However, in terms of commercially available songs, in recent years, many popular tracks have undergone heavy coloration during the mastering process. Some audio engineers, in order to compete in the market, sometimes push the audio to its limits. Therefore, having a playback device that introduces secondary coloration is not ideal for me. And if you're listening to natural instruments like orchestral recordings, they are typically recorded on expensive low-distortion equipment. So, aiming for low-distortion playback is also not the wrong direction to pursue.

But if you do enjoy additional harmonic distortion, that's your prerogative. In this case, you don't have to consider the side effect of image contraction as a bad thing.
Rarely do headphones exhibit continuous distortion across the entire frequency range. Generally, distortion occurs individually in the low frequencies, mid frequencies, or high frequencies. Distortion in narrow frequency bands is less noticeable than in the demonstration audio.


② Channel Imbalance / Skew / ILD

Headphones that have consistent left and right frequency response are considered better headphones, and this goes without saying. If one side produces audible channel imbalance over a wide range, with everything biased towards one side, the headphones will become unusable.

This is an audio demonstration of channel imbalance across different frequency ranges to help you better understand this sensation. I actually roughly simulated a pair of problematic M20x headphones I encountered before (but with more emphasis on mid-frequency channel imbalance).
3D Mixing space front 2023 M20x sample1.jpg
3D Mixing space side 2023 M20x sample1.jpg


If there is a channel imbalance of 1-2dB while listening to a pure sine wave, it will be very noticeable. However, in music, some narrow frequency range imbalances may not be as pronounced as in the previous case. But multiple narrow frequency range imbalances can actually create a smearing effect on the soundstage, causing originally solid and spatially defined sounds to become diffuse and less coherent. This results in a sensation of "sound coloring" that is different from harmonic distortion. That's why ILD (Interaural Level Difference) data is also incorporated into the calculation of the 3D image from the side.

Lastly, the reason we only stay at 86dB SPL for the side image on headphones is because it best represents the real listening volume for music. The situation would certainly become more demanding at higher sound pressure levels, but in those cases, it is more important to prioritize the health of our hearing abilities over the slight differences in sound quality. In speaker evaluations, I will demonstrate the three levels of sound pressure because it may involve listening in the mid to far field.

After presenting all these 3D images, I will provide some brief textual explanations to supplement subjective experiences that cannot be fully conveyed in the 3D images. Subjectivity is important for ordinary users, but lengthy discussions are clearly inefficient and prone to misunderstandings. Therefore, I have delegated most of the information to the 3D images, leaving only a minimal amount of content in the text.
 
Last edited:
OP
Cuckoo Studio

Cuckoo Studio

Member
Reviewer
Joined
Aug 13, 2022
Messages
97
Likes
878

7.Q&A and some self-introductions.


This is all about the measurement conditions and chart analysis of Cuckoo Studio Review. The preceding content may undergo some updates over time and based on your suggestions, but for now, this is how it stands.
The link to this post will be included in every new review of mine. If you still have any questions about the previous content, you can ask me in the comments section below this post or under the review, and I will reply to you when I see it. Thank you!


Some questions and answers encountered previously:


Q: Is Cuckoo Studio a team?


A: As of June 2023, currently, I am the only person conducting all the data measurements and content creation. I always use the term 'we' in the text because my wife assists me with some coordination and publishing tasks. She has her own career and is very busy, but she helps me in her free time with no complaints. That's why I can't just say 'I.' And if in the future, like-minded people come to help, the term 'we' can still be used.


Q: Where do you get the headphones for your reviews?

A: There are three sources: personal purchases, donations from followers, and units provided by manufacturers.


Q: What is your main source of revenue?

A: Although music is my career, product reviews now take up most of my time, and the cost of living in Beijing is high. I received advice from a senior colleague. Now if manufacturers send me products for review, I will start charging a fee for all the production I will make.
However, we will sign a paper agreement stating that "the fee is limited to the cost of graphic and video making,they can not decide the content of the video. There won't be any manufacturer-customized content, nor will I accept reciting, or editing." Of course, as you can imagine, under such constraints, no manufacturer is willing to spend money on releasing a bad product and receiving negative reviews. This becomes a screening mechanism. I will return the defective products to the manufacturers, and the ones I keep are generally the more outstanding ones.

Q: Why do you publish review content on the ASR forum?

A: I believe that giving back to the community is very important. Before I started reviewing, I learned a lot of knowledge from ASR. Now, I want to contribute more data and experiential results here to benefit more people.


The least important things are placed at the end. Here is my self-introduction:

Anzol: musician, mixing engineer, reviewer. Started music production in 2011, began working as a mixing engineer and teaching music production in 2015, and established Cuckoo Studio Review in 2021.

Part of my mixing works :


Personal music works:


(26 tracks, but currently only this song has been synchronized here. This is because this song is signed with Sony Music, and they have done a full-platform release. I haven't spent much time on full-platform releases for other songs, but maybe I will do so recently.)


总和 2工作室.jpg


PS: When you come to Beijing, you can come to my place and taste my handmade fresh squeezed grape oolong tea, and order some pizzas and snacks while chatting about music and sound. I will always welcome you, my friend.
 
Last edited:
OP
Cuckoo Studio

Cuckoo Studio

Member
Reviewer
Joined
Aug 13, 2022
Messages
97
Likes
878
This floor is reserved for future updates.

I have spent a considerable amount of time here, if there are any mistakes or suggestions for modifications in the previous content, please feel free to point them out and help me improve the content. Whether you treat me strictly or kindly, I will respond friendly, so perhaps peaceful communication can save your valuable energy ;)
 
Last edited:

MayaTlab

Addicted to Fun and Learning
Joined
Aug 15, 2020
Messages
956
Likes
1,593
I found a detailed comparison of E610A and RA0045:
It has quite good data results.

Thanks for sharing. One thing to note is that there probably is excessive sample variation among couplers, so Earfonia's experience may not necessarily be representative of yours (Also, a) that post concerns their ICP prepolarized coupler, but I've seen the data from their plug-in-powered coupler and it's very close, and b) some of the IEMs drifted a bit over time, so some of the difference comes from that, not the couplers).

I guess that you've already done so, but since you've got two of them (at least ?), have you directly compared them ? Yours are the plug-in power ones ?

Do you think that you'd like to join CSGlinux's tour ?

more of my own measurement data compare to the data from @crinacle and @oratory1990 .

Can I suggest trying to digitise the data instead of overlaying graphs ?
With programs like this it's fairly easy to do : https://automeris.io/WebPlotDigitizer/

You may also want to give a look at CSGlinux's database as a point of comparison, they use a RA0045 as well : https://www.hypethesonics.com/

In the case of both Oratory and CSGlinux, the data can be directly obtained as csv files if you want to.

I am not very satisfied with this pinna. The overall data obtained is quite similar, but it exhibits some shelving attenuation of 3-4dB at high frequencies. While it may match some real human ears, it is too “warm” compared to the data used in several mainstream databases such as GRAS KB5000/KB5001/KB5010. After some searching, I was recommended to purchase a pair of pinnas made by @JohnYang1997 . It is not officially available on the market (as of the completion of this article), but I was able to purchase this pair of excellent pinnas through a one-on-one arrangement, and most importantly, it is fully compatible with my rig.

I take it that John Yang's pinna is softer than the clone that was delivered with the mount ? Do you know on which "official" pinna it is based on ?

When testing IEMs, am I understanding it correctly that you use the metal canal extension instead of the pinna ?

Other equipment: I use the MOTU Ultralite AVB interface, with the Main Out connected to the Topping L30 headphone amplifier.

So if I understand this correctly, the couplers are connected to the mic in of the MOTU, and the headphones to the L30's out ?
 
OP
Cuckoo Studio

Cuckoo Studio

Member
Reviewer
Joined
Aug 13, 2022
Messages
97
Likes
878
Thanks for sharing. One thing to note is that there probably is excessive sample variation among couplers, so Earfonia's experience may not necessarily be representative of yours (Also, a) that post concerns their ICP prepolarized coupler, but I've seen the data from their plug-in-powered coupler and it's very close, and b) some of the IEMs drifted a bit over time, so some of the difference comes from that, not the couplers).

I guess that you've already done so, but since you've got two of them (at least ?), have you directly compared them ? Yours are the plug-in power ones ?
My base has a female BNC interface, which is different from Earfonia's. This is a detailed view after disassembly.

微信图片_20230619210033.jpg


Perhaps I can find a new opportunity to borrow an RA0045 for a direct comparison. I have two E610A units, so it's convenient to compare them, and I can update the data here more quickly.
Do you think that you'd like to join CSGlinux's tour ?
I would love to, but I'm actually not sure how to contact them or if they support the Asian region.

Can I suggest trying to digitise the data instead of overlaying graphs ?
With programs like this it's fairly easy to do : https://automeris.io/WebPlotDigitizer/

You may also want to give a look at CSGlinux's database as a point of comparison, they use a RA0045 as well : https://www.hypethesonics.com/

In the case of both Oratory and CSGlinux, the data can be directly obtained as csv files if you want to.
Great suggestion! I have used WebPlotDigitizer many times before, but this time I chose to use the method of overlapping charts because pre-existing charts are more difficult to modify (at least with my Photoshop skills), which may make them more convincing, although it does sacrifice some clarity. I will try to convert it into data as per your advice, but I may also keep the overlapped charts.

I take it that John Yang's pinna is softer than the clone that was delivered with the mount ? Do you know on which "official" pinna it is based on ?

When testing IEMs, am I understanding it correctly that you use the metal canal extension instead of the pinna ?
I'm not quite sure. They are both not very soft, as I have felt softer clone pinnae which are bad. I'm also not sure which model John Yang's pinna is based on. Perhaps you can consult him for more details. Also, yes, the measurement data for the IEMs in this post was conducted on metal canal.

So if I understand this correctly, the couplers are connected to the mic in of the MOTU, and the headphones to the L30's out ?

two TRS‘s on the back connect to L30.
fasfa.jpg
 

MayaTlab

Addicted to Fun and Learning
Joined
Aug 15, 2020
Messages
956
Likes
1,593
Perhaps I can find a new opportunity to borrow an RA0045 for a direct comparison.

I think that this would be ideal as a direct comparison like this would control for sample variation and operator's methodology / practice. CSGlinux's tour was an attempt at controlling for sample variation, but some IEMs drifted over time and some are quite susceptible to different operators measuring them in slightly different ways.
Some IEMs may have low enough sample variation across a decent part of the spectrum that you can already purchase a few of them to get a first idea of whether or not the clone you've purchased can be presumed decent or is already too far off, but this isn't the ideal way to go.

I would love to, but I'm actually not sure how to contact them or if they support the Asian region.

Contact them directly on head-fi : https://www.head-fi.org/members/csglinux.399084/#recent-content
Otherwise you can contact them via Discord as well.

I'm not quite sure. They are both not very soft, as I have felt softer clone pinnae which are bad. I'm also not sure which model John Yang's pinna is based on. Perhaps you can consult him for more details. Also, yes, the measurement data for the IEMs in this post was conducted on metal canal.

Have you experimented with the newer soft pinna that's appeared on Aliexpress and other websites ?
 
OP
Cuckoo Studio

Cuckoo Studio

Member
Reviewer
Joined
Aug 13, 2022
Messages
97
Likes
878
Top Bottom