• WANTED: Happy members who like to discuss audio and other topics related to our interest. Desire to learn and share knowledge of science required. There are many reviews of audio hardware and expert members to help answer your questions. Click here to have your audio equipment measured for free!

yewneek

Member
Joined
Jan 5, 2020
Messages
66
Likes
32
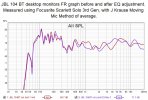
Following recent discussions with helpful members of this board, and finding the Youtube videos of Julian Krause very informative, I have concluded the preliminary investigation and equalisation/correction of my JBL 104 BT desktop monitors.

My methodology was to purchase and install a calibrated measurement microphone, from Sonarworks. Use this with REW and interfaced using a Focusrite Scarlett Solo 3rd Gen. I believe I followed the Moving Microphone Method, as outlined in the instructional method in the Youtube video by J Krause.

Please find the files attached with my results.

Comments and constructive critique welcome.

GB

The summary graph before and after.
Link to mdat files on mega.io
JBL 104 BT EQ adjusted.jpg


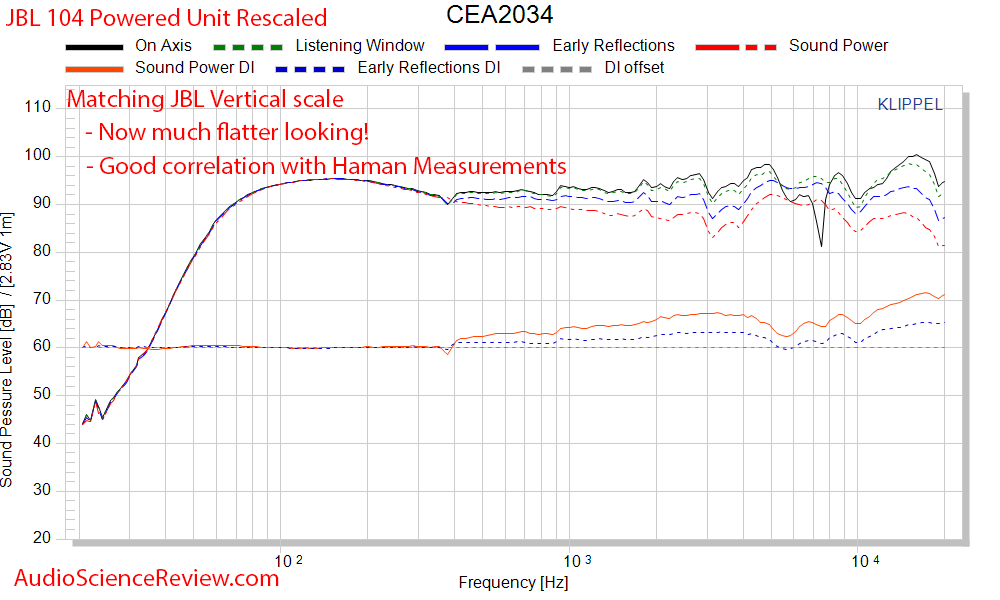
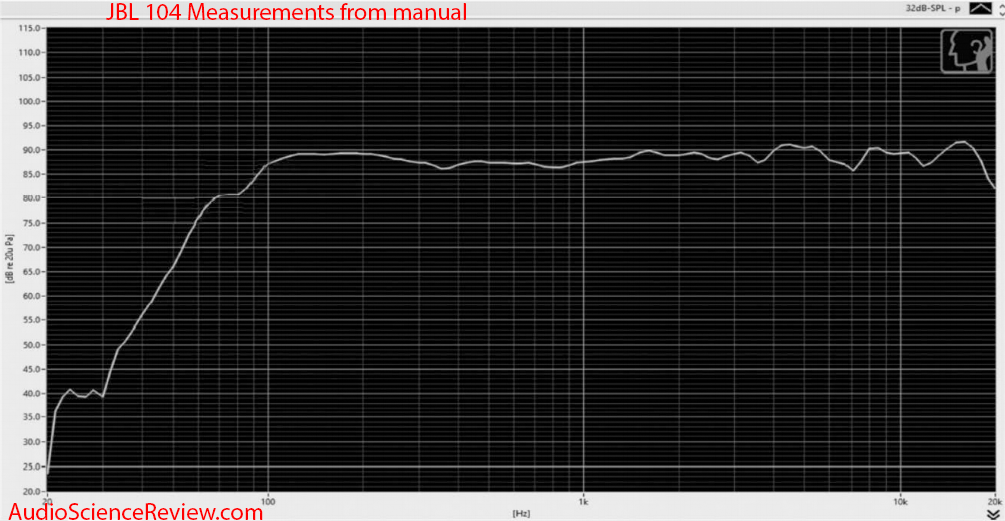
Below are the published findings from @amirm and from the JBL literature
index.php

JBL published FR graph
index.php
 

staticV3

Master Contributor
Joined
Aug 29, 2019
Messages
8,010
Likes
12,851
Comments and constructive critique welcome.
Please use a vertical dB range of ~50dB for your graphs.
What you have currently (200dB top to bottom) hides all details.

Similarly, the frequency range is best set to 20-20kHz. REW has a button specifically for that in the bottom right-hand side corner of the SPL graph.

Edit: also helpful to align the two graphs to more clearly show the differences. In your case, I would align the two at ~125Hz (use the Align SPL function in REW).

Lastly, I would make sure that both graphs use a consistent line width. To do that, open the REW preferences, then Appearance, then turn off "Thicker traces for AVG".
 
OP
Y

yewneek

Member
Joined
Jan 5, 2020
Messages
66
Likes
32
Presentation, but not the data! There's hope for me yet!

Cheers for the nudges. Duly noted.

GB
 
OP
Y

yewneek

Member
Joined
Jan 5, 2020
Messages
66
Likes
32
Please use a vertical dB range of ~50dB for your graphs.
What you have currently (200dB top to bottom) hides all details.

Similarly, the frequency range is best set to 20-20kHz. REW has a button specifically for that in the bottom right-hand side corner of the SPL graph.

Edit: also helpful to align the two graphs to more clearly show the differences. In your case, I would align the two at ~125Hz (use the Align SPL function in REW).

Lastly, I would make sure that both graphs use a consistent line width. To do that, open the REW preferences, then Appearance, then turn off "Thicker traces for AVG".
How do I set the range of dB as asked? The range of results is outside 50dB even between 20-20kHz. What top to what bottom?

This is new to me and getting up to speed on technical stuff as a rookie technician is implicitly easy for those with the knowledge!
Cheers

GB
 

staticV3

Master Contributor
Joined
Aug 29, 2019
Messages
8,010
Likes
12,851
I downloaded the MDAT file. Here's how I would present the data:
JBL 104BT Stock vs EQed in-room Response.png

Some notes:
  • You said you followed the Moving Microphone Method, yet from the measurements it looks like you did a bunch of sweeps at different microphone positions, then averaged them.
  • Post EQ doesn't really look any better than stock
  • There's a pretty big trough in the midrange, even after EQ
 
OP
Y

yewneek

Member
Joined
Jan 5, 2020
Messages
66
Likes
32
It may not be splendid, but I hope it's sufficient!

I'm going to measure some more stuff now.

Cheers for the tips!


GB
 

Attachments

  • JBL 104 BT EQ adjusted1.jpg
    JBL 104 BT EQ adjusted1.jpg
    170.4 KB · Views: 78
Top Bottom