• WANTED: Happy members who like to discuss audio and other topics related to our interest. Desire to learn and share knowledge of science required. There are many reviews of audio hardware and expert members to help answer your questions. Click here to have your audio equipment measured for free!

HouseCurve iOS app with GEQ?

UndercoverNerd

New Member
Joined
Mar 20, 2024
Messages
3
Likes
1
Complete noob here.

I don't yet have a DSP but figured I would toy with the HouseCurve app in the interim. My Yamaha RX-v383 is a little baby and only allows me YPAO PEQ or REQ adjustments at set frequency intervals between 63hz and 16khz

Was curious if I could somehow translate from the PEQ adjustments in app to the GEQ?

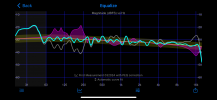
I ended up adjusting values until I got a fairly decent curve?! and movies sound like @$$ lol Here's what it looks like. Did I over EQ by compressing too much? That's the obvious hunch
 

Attachments

  • IMG_1628.png
    IMG_1628.png
    257.9 KB · Views: 59
Last edited:
Hi @UndercoverNerd! Welcome to ASR.

If I understand correctly, your HouseCurve screenshot shows the system's uncorrected response in gray, with the calculated PEQ filters in purple and the estimated corrected response in blue.

Since you can't use that PEQ correction, it would be interesting to see what your manually YPAO adjusted system measures like.

Or is the gray graph your YPAO adjusted system response?

But then why run HouseCurve's PEQ generator on top of that, if you can't apply it anyway?
 
The grey line is the initial measurement with EQ completely off. You bring up a good point though with the blue and magenta colors. Now I don't know which is which but after hopping back into the app I can see that the blue is the estimated curve response and the magenta is the current response with the GEQ adjustments. Look like I may have interpreted things completely wrong!

For that you are helpful :)

As an IT guy who tinkers I figured I would try something different than YPAO as it's giving it a metallic and too bright of a sound IMO. For fun mostly
 
Now I don't know which is which but after hopping back into the app I can see that the blue is the estimated curve response and the magenta is the current response with the GEQ adjustments.
At least in your first screenshot, the magenta graph does 100% not show the current speaker response with GEQ adjustments.

Instead, it shows the response of the PEQ filters that HouseCurve calculated to get from the gray raw speaker response to the theoretical blue post-EQ response, normalized to the orange target response.
That makes complete sense. While there's no way to control Gain or Q per XYZ frequency in this specific receiver, I was able to do a sweep with EQ off and then based on the initial readings (the gray line), adjust the GEQ accordingly and the vocals are much better and far less bright and tinny. I'll play with it more in a few. The wife fell asleep on the couch and I don't think she'd appreciate the noise lol

I'm glad you sparked these little nuggets of info!
 
That’s a good strategy. When you do this iteratively - measure, adjust, measure, adjust and so on - you should be able to hit your target curve quite closely.

This process is briefly described here in the HouseCurve documentation.

If you can measure using REW or import your measurements into REW, you can use REW’s EQ curve fitting power which does support fixed frequency values.

If your Q’s are fixed as well such as with a classic GEQ, you can even make it only find the optimal Gain adjustments. I have successfully mimiced a DEQ2496 GEQ this way.

Hope this helps!
 
Back
Top Bottom