MengW
Member
- Joined
- Jun 30, 2022
- Messages
- 63
- Likes
- 44
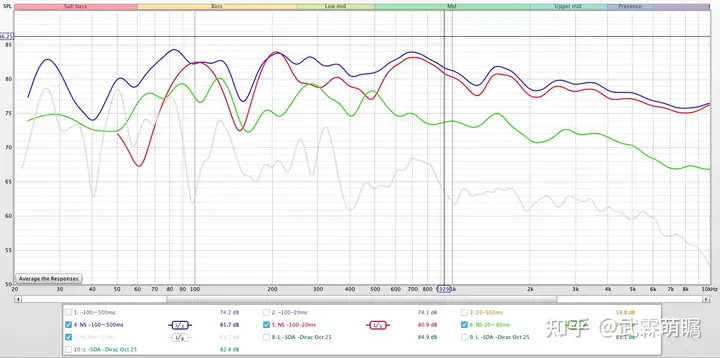
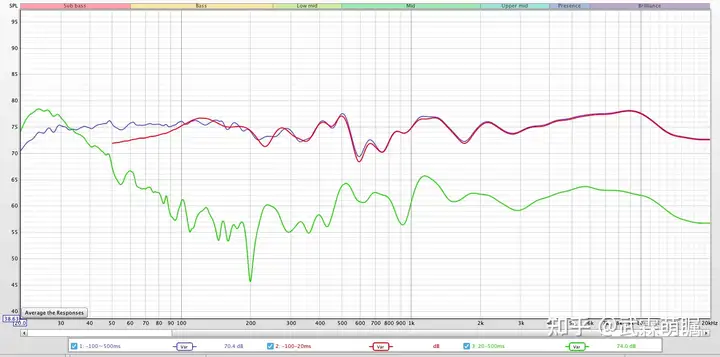
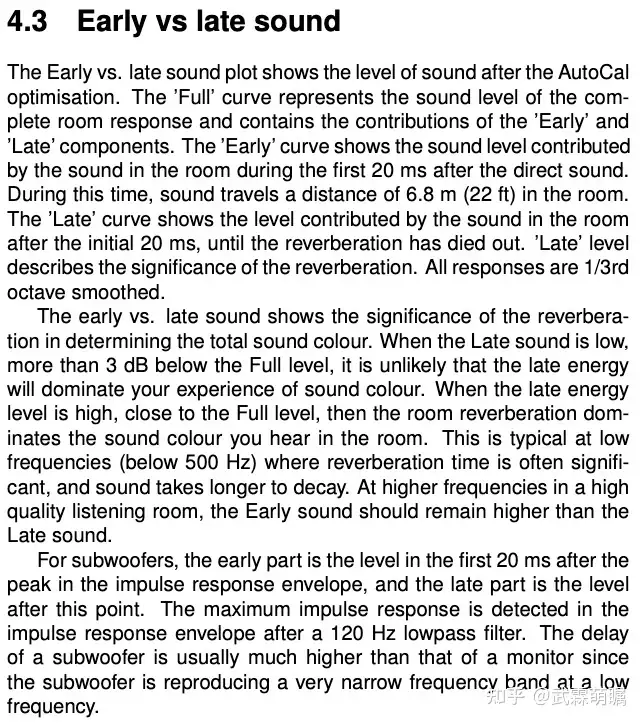
There is the early and late frequency response in Genelec GRADE report.
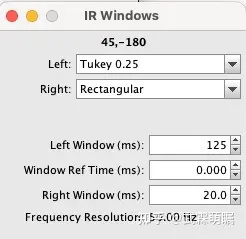
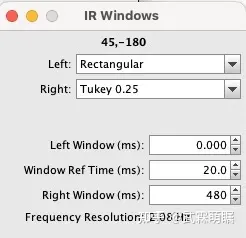
I can use the IR windows of REW and get the frequency response of 0-20ms above 50Hz, but, cannot change the Left window value in IR windows to negative, such as -20ms, to get the curve after 20 ms.

I found out the Cumulative Energy Time from Dr. Floyd Toole paper (The Measurement and Calibration of Sound Reproducing Systems) and Leembruggen SMPTE report
 www.aes.org
Do you think I can get some similar information from REW?
There is one data named Peak energy time in REW Spectrogram Graph. Do you think it's close to the cumulative energy time?

Thanks.
I can use the IR windows of REW and get the frequency response of 0-20ms above 50Hz, but, cannot change the Left window value in IR windows to negative, such as -20ms, to get the curve after 20 ms.
I found out the Cumulative Energy Time from Dr. Floyd Toole paper (The Measurement and Calibration of Sound Reproducing Systems) and Leembruggen SMPTE report
AES E-Library » The Measurement and Calibration of Sound Reproducing Systems
For decades, it has been widely accepted that a steady-state amplitude response measured with an omnidirectional microphone at the listening location in a room is an important indicator of how an audio system will sound. This paper examines both small and large venues, home theaters to cinemas...
Do you think I can get some similar information from REW?
There is one data named Peak energy time in REW Spectrogram Graph. Do you think it's close to the cumulative energy time?
Thanks.
Last edited: