• WANTED: Happy members who like to discuss audio and other topics related to our interest. Desire to learn and share knowledge of science required. There are many reviews of audio hardware and expert members to help answer your questions. Click here to have your audio equipment measured for free!

Can I get the early and late frequency response and cumulative energy time from REW?

MengW

Member
Joined
Jun 30, 2022
Messages
63
Likes
44
There is the early and late frequency response in Genelec GRADE report.

I can use the IR windows of REW and get the frequency response of 0-20ms above 50Hz, but, cannot change the Left window value in IR windows to negative, such as -20ms, to get the curve after 20 ms.


1682044654711.png


I found out the Cumulative Energy Time from Dr. Floyd Toole paper (The Measurement and Calibration of Sound Reproducing Systems) and Leembruggen SMPTE report

Do you think I can get some similar information from REW?

There is one data named Peak energy time in REW Spectrogram Graph. Do you think it's close to the cumulative energy time?

1682046052516.png


Thanks.
 
Last edited:

ernestcarl

Major Contributor
Joined
Sep 4, 2019
Messages
3,113
Likes
2,330
Location
Canada
There is the early and late frequency response in Genelec GRADE report.

I can use the IR windows of REW and get the frequency response of 0-20ms above 50Hz, but, cannot change the Left window value in IR windows to negative, such as -20ms, to get the curve after 20 ms.


View attachment 280574


I found out the cumulative energy time from Dr. Floyd Toole paper (The Measurement and Calibration of Sound Reproducing Systems) and Leembruggen SMPTE report

Do you think I can get some similar information from REW?

There is one data named Peak energy time in REW Spectrogram Graph. Do you think it's close to the cumulative energy time?

View attachment 280577

Thanks.

You should get something similar to the "early" FR curve by applying a FDW of 5-7 cycles, and maybe 1/3 to 1/6 smoothing.

By adjusting the "rise time" to anywhere between 10-30ms, the second trace (20ms trace) in the cumulative spectral decay view can be considered as your "late" FR curve.

The full FR curve you could choose either 1/6 or 1/3 smoothing -- as will become apparent, REW does not have an option for applying manually adjustable sliding scale algorithms in its filters so you'd have to make do with whatever smoothing options are available...

If you want to overlay all three curves simultaneously, you'll need to manually create a separate copy of the full FR curve in order to apply FDW (early FR), as well as extract the 20ms trace from the CSD view using a plot digitizer for your late FR curve.

Can't say what settings adjustment would give you the most similar result to Genelec's own graphs as I do not have my own Genelec monitors and accompanying GRADE report to contrast with...
 

ernestcarl

Major Contributor
Joined
Sep 4, 2019
Messages
3,113
Likes
2,330
Location
Canada
There is one data named Peak energy time in REW Spectrogram Graph. Do you think it's close to the cumulative energy time?
Spectrogram Graph

I dunno... that last plot kind of just looks like a frequency selective curve of the RT(?) Sorry, too lazy to read the PDF file. You "might" be able to get a similar or even better intuitive feel of a room by just using the spectrogram views. *Experience is needed here. Think of a doctor reading an x-ray or mammogram.
 
OP
MengW

MengW

Member
Joined
Jun 30, 2022
Messages
63
Likes
44
I dunno... that last plot kind of just looks like a frequency selective curve of the RT(?) Sorry, too lazy to read the PDF file. You "might" be able to get a similar or even better intuitive feel of a room by just using the spectrogram views. *Experience is needed here. Think of a doctor reading an x-ray or mammogram.

Thanks for your reply.

Cumulative energy time, the time taken after the arrival of the direct sound for the sound field to rise to the steady-state level.

From the report, I found that the correlation between Cumulative energy time and reverberation time (RT) is very strong in LF.

1682067101331.png

-
-
1682068304303.png


1682067902110.png


1682067894677.png


1682068014059.png
 
Last edited:
OP
MengW

MengW

Member
Joined
Jun 30, 2022
Messages
63
Likes
44
You should get something similar to the "early" FR curve by applying a FDW of 5-7 cycles, and maybe 1/3 to 1/6 smoothing.

By adjusting the "rise time" to anywhere between 10-30ms, the second trace (20ms trace) in the cumulative spectral decay view can be considered as your "late" FR curve.

The full FR curve you could choose either 1/6 or 1/3 smoothing -- as will become apparent, REW does not have an option for applying manually adjustable sliding scale algorithms in its filters so you'd have to make do with whatever smoothing options are available...

If you want to overlay all three curves simultaneously, you'll need to manually create a separate copy of the full FR curve in order to apply FDW (early FR), as well as extract the 20ms trace from the CSD view using a plot digitizer for your late FR curve.

Can't say what settings adjustment would give you the most similar result to Genelec's own graphs as I do not have my own Genelec monitors and accompanying GRADE report to contrast with...
Yes, I found that it takes a lot of knowledge of acoustics and psychoacoustics to use REW well, and I think I will keep on studying hard.

Btw, currently, I still can't understand the different values of 1000Hz after 100ms, in RT60 decay, Decay, Spectrogram Fourier mode and Wavelet mode.

1682071820813.png

截屏2023-04-21 18.10.37.jpg
截屏2023-04-21 18.12.13.jpg
截屏2023-04-21 18.13.34.jpg
 

JohnPM

Senior Member
Technical Expert
Joined
Apr 9, 2018
Messages
344
Likes
920
Location
UK
I can use the IR windows of REW and get the frequency response of 0-20ms above 50Hz, but, cannot change the Left window value in IR windows to negative, such as -20ms, to get the curve after 20 ms.
Just change the window reference time to move it. You can also drag the reference marker on the Impulse graph to reposition it.
 
OP
MengW

MengW

Member
Joined
Jun 30, 2022
Messages
63
Likes
44
You should get something similar to the "early" FR curve by applying a FDW of 5-7 cycles, and maybe 1/3 to 1/6 smoothing.

By adjusting the "rise time" to anywhere between 10-30ms, the second trace (20ms trace) in the cumulative spectral decay view can be considered as your "late" FR curve.

The full FR curve you could choose either 1/6 or 1/3 smoothing -- as will become apparent, REW does not have an option for applying manually adjustable sliding scale algorithms in its filters so you'd have to make do with whatever smoothing options are available...

If you want to overlay all three curves simultaneously, you'll need to manually create a separate copy of the full FR curve in order to apply FDW (early FR), as well as extract the 20ms trace from the CSD view using a plot digitizer for your late FR curve.

Can't say what settings adjustment would give you the most similar result to Genelec's own graphs as I do not have my own Genelec monitors and accompanying GRADE report to contrast with...
Hello,

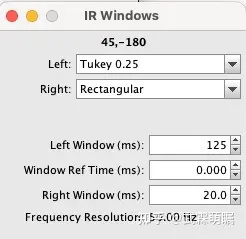
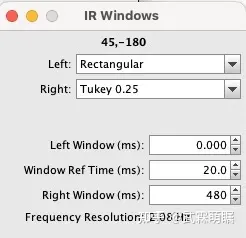
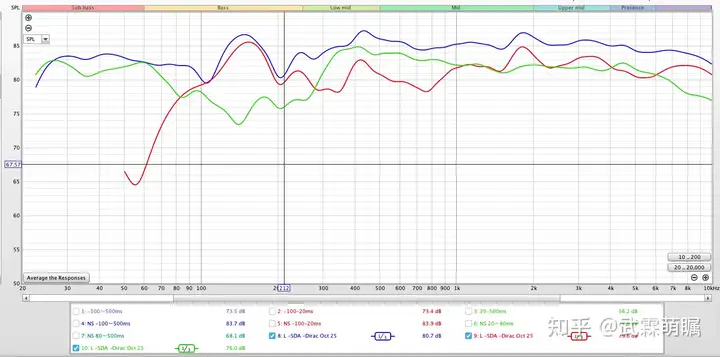
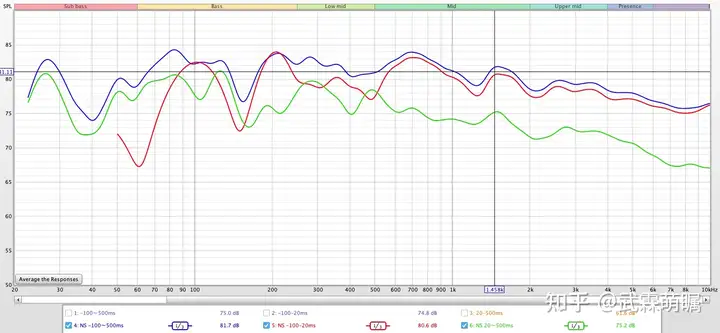
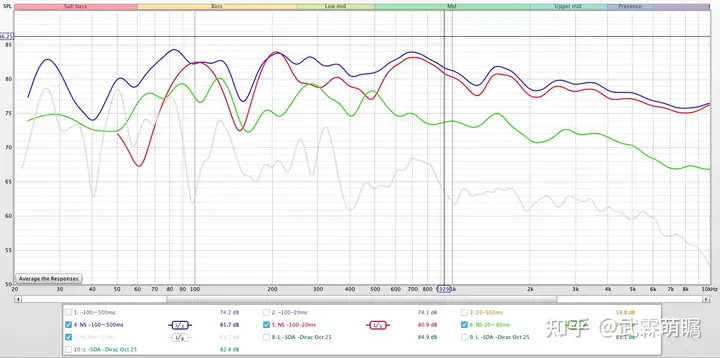
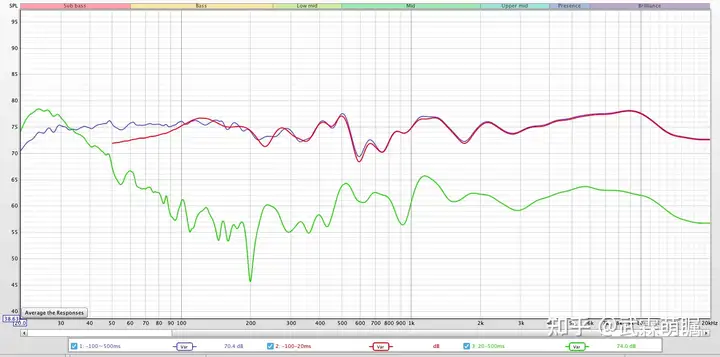
Follow the JohnPM's reply, I got the early and late curve with REW.

full -125~500ms, blue

early -125~20ms, red
v2-b28cb3eaff50935c3d139afefd97bcb5_720w.webp


late 20~500ms, green
v2-2b58b2e5e38726be4003de8d3c3ac930_720w.webp


Friend A, Polk audio SDA speakers+Dirac, less room acoustic treatment.
There are a lot of late energy.
v2-301490b2691c2bb22e4c41d766af3d8a_720w.webp


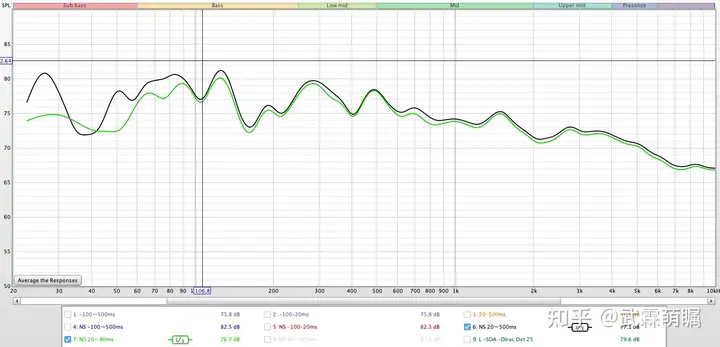
Friend B, 2 way 8' speakers, with 6 pcs 1.8x0.6x0.1m absorption panels.
v2-808758bf128d297f8b54e5c9341656cd_720w.webp


20~80ms green, 80~500ms grey.
v2-756f8bd0bb7864b00762f0f5bb2ea1e1_720w.webp


20~80ms green, 20~500ms black.
v2-8af6b1c24e003e20de099a2a41449315_720w.webp


8351+W371+AVAA+Polyester
v2-d2551fba90ec5f1c912a872abb0864ae_720w.webp


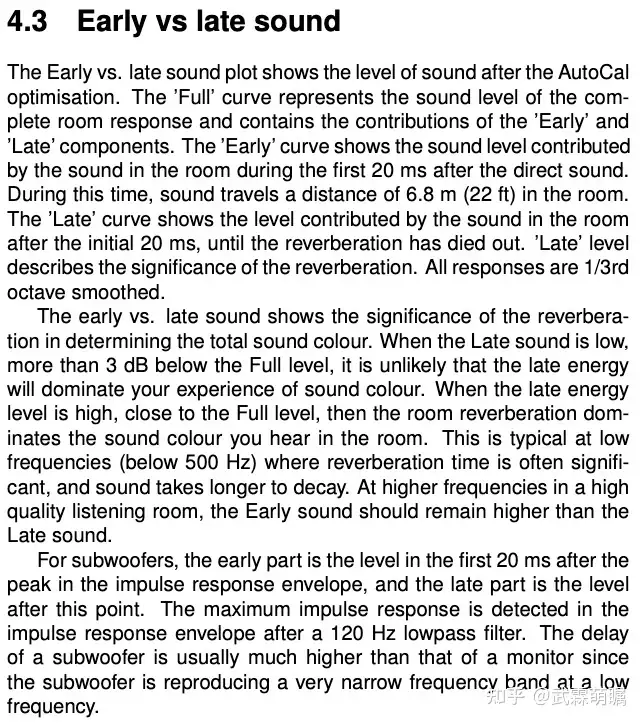
Some notes in GRADE report.
v2-74443ab1b073a6b9791cdc8fb64300b9_720w.webp


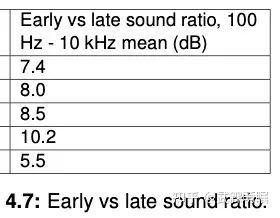
And 100 Hz~10 kHz ratio mean result table.
v2-d8d1e8c006ce837fd2719fe5a421c5c0_720w.webp
 
Top Bottom