Hi
AN early session with my new toy and goto and likely endgame Headphones. Long story shortened here. I had the original HE6. It was used with a Yamaha CA-1000 and a speaker to headphones adapter. I used the vintage CA-1000 on Class A, A great amplifier that can be switched to work on Class A , at a substantial reduction in output , 25 wpc max. Great combo but energy inefficient, the amplifier would consume around 500 watts on Class A and heat like a furnace ... I used the Atom but it was barely adequate for ... I came to use an HifiMan HE560, mostly ... then you People!

, had me look into the Hifiman HESEv2. I got it for around $499.00. The first sample was DOA, (of course would say the negative people, this is a rather alarmingly recurring problem of DOA samples from Adorama.... So yes! My first sample came DOA, with torn membrane on the left side. Communicated with HifiMan and they promptly sent me a new unit and ...
The hobby is full of hyperboles. I will refrain from using these , especially the often used "bargain" but the chain I presently have for my headphones system verges on the superlative, yet doesn't cost a lot. Not often does one get SOTA for relatively modest cash outlay... An endgame
system for this amount of money, tend to be called that .. Ok Pas cher.
.
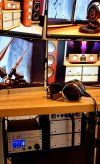
| Raspberry Pi as a streamer and EQ. | $100 |
| Khadas Tone Board for DAC, Soon to be replaced for convenience by a Topping D10 | $100 |
| Drop THX AAA789 Amplifier | $150 |
| HifiMan HE6SEvw | $500 |
| |
| Total | $850.oo |
Top flight, by any metrics, be these objective or subjective. SINAD? Top of the Class. Bass extension? Out of this World. FR Linearity, once EQ and this headphones can take a absurd leve of EQ... THD for the transducers? What does 0.1 % or less across most of the audible spectrum sounds like ?
All that for less than $1 K. Some people would utter the dread "barg.... " word. I won't
I would encourage those who are into headphones to consider or at least audition it , if they can.
Peace.