• WANTED: Happy members who like to discuss audio and other topics related to our interest. Desire to learn and share knowledge of science required. There are many reviews of audio hardware and expert members to help answer your questions. Click here to have your audio equipment measured for free!

Clipping & Underpowered Speakers

D

Deleted member 46664

Guest
What other possible distortions tho? A weak amp can be pushed into clipping (distortion) sooner than a more powerful one. There aren't any other possible distortions if operated within spec. If you're only using at most 20 watts it doesn't matter if it's a 200 watt amp or a 50 watt amp. The 50 watt amp isn't going to distort any more than the 200 watt amp until you exceed its capabilities.
That's correct ... the question is how quickly you use up your amp.
Outside of clipping it makes no difference at all ... but a 20 watt amp is going to clip a long time before it's 100 watt cousin.
 

Pogre

Active Member
Joined
Mar 5, 2022
Messages
209
Likes
257
That's correct ... the question is how quickly you use up your amp.
Outside of clipping it makes no difference at all ... but a 20 watt amp is going to clip a long time before it's 100 watt cousin.
Exactly. Which is why I'm confused about this "other possible distortions" question. There aren't any. Not until you exceed capabilities, and at that point it's pretty self explanatory. If you're running into clipping at your desired levels then you need a more powerful amp.
 

Spkrdctr

Major Contributor
Joined
Apr 22, 2021
Messages
2,235
Likes
2,968
Exactly. Which is why I'm confused about this "other possible distortions" question. There aren't any. Not until you exceed capabilities, and at that point it's pretty self explanatory. If you're running into clipping at your desired levels then you need a more powerful amp.
I tried to say the same thing but in a long winded version. Thanks for making it in an easy 4 sentence version. Good work!
 
Last edited:

gnarly

Major Contributor
Joined
Jun 15, 2021
Messages
1,042
Likes
1,483
View attachment 201174

Hmm well this is only the YouTube version but I still see the usual tapering off towards the high end.
Interesting, thx. I have no idea if the Youtube is different from the CD ...guess i could compare them to find out...but i'm also very inexperienced with software analysis of music tracks. I've played with Goldwave and Audacity a bit, but not enough.

Is the spectral distribution shown in the middle plot (the gold cloudlike star trail) a spectral average over the whole track?
If so, that could help explain things... as the track has a number of intense percussive hits, and HF synthesizer stuff going on towards the end, which are the tweeter destructive parts.


My 5-way setup has amp monitoring for each of the ways, so i can watch the christmas tree lights to see how hard each section is being driven.
Frankenstein definitely lights up the HF and VHF amp channels' trees considerably more than most songs, relative to the other amp sections.

Also have full computer monitoring of amp channels.
Here's a snip of the HF (1000-6300Hz) and VHF (6300 up) sections, at a random point in the song towards the end.. Meters can be set to Peak or RMS, but it's kinda impossible to follow how fast Peak moves. The meters help me see the distribution of spectral content.
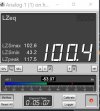
Anyway, here's also a snip of REW's SPL meter taken just now, over the entire song...SPL is accurate @1m.

Frankenstein 1.JPGFrankenstein 1.JPG

You can see how low the amp levels were, even playing at 100dB... a really powerful system!
I've heard the prosound guys say that big-brass bands work the high end the hardest, of any genre...
 

gnarly

Major Contributor
Joined
Jun 15, 2021
Messages
1,042
Likes
1,483
Ohh... that's a new one for me. I always play around with this one.

From a quick look at that calculator, it appears the result is peak RMS SPL. Very different from true Peak SPL.
I think that calculator maps to 100.4dB LZ average like i just posted above (and will post here again to try to explain what i think)
Frankenstein 1.JPG


Let's say the linked calculator gave a 100.4 dB result given its inputs..
Typical amps only have a few dB of headroom above their RMS rating, and would rather fairly reflect available headroom in line with the meters 102.6 dB LZSmax reading. That 102.6 dB is dang close to Peak SPL available.
And there's no way the amp will have the headroom available for the 117.5 dB LZpeaks.
Personally, I'd back that calculator's results down by about 15-18dB, for unclipped headroom.
 

Aerith Gainsborough

Addicted to Fun and Learning
Joined
May 4, 2020
Messages
855
Likes
1,282
Is the spectral distribution shown in the middle plot (the gold cloudlike star trail) a spectral average over the whole track?
They are the measured peaks at a given frequency.

It is a treble heavy track, absolutely but I haven't seen anything unnaturally stressful here.
Again, it is possible that the YT version is EQ'd somehow.

Really cool power meter of your amp :D

Listening to it, I would not want to go beyond my typical 90dB LZ-peak setting.
The high end is prominent enough to fry my ears. No clue how people tolerate 100dB+ of this. o_O
 

Pogre

Active Member
Joined
Mar 5, 2022
Messages
209
Likes
257
From a quick look at that calculator, it appears the result is peak RMS SPL. Very different from true Peak SPL.
I think that calculator maps to 100.4dB LZ average like i just posted above (and will post here again to try to explain what i think)
View attachment 201197

Let's say the linked calculator gave a 100.4 dB result given its inputs..
Typical amps only have a few dB of headroom above their RMS rating, and would rather fairly reflect available headroom in line with the meters 102.6 dB LZSmax reading. That 102.6 dB is dang close to Peak SPL available.
And there's no way the amp will have the headroom available for the 117.5 dB LZpeaks.
Personally, I'd back that calculator's results down by about 15-18dB, for unclipped headroom.
Yeah it doesn't account for headroom. It also doesn't account for speakers that aren't 8 ohms. Add to that, even an 8 Ohm rated speaker isn't 8 Ohms through the entire frequency range. So it isn't rock solid accurate, but is close enough to ballpark it. Plus it's a pretty good tool for demonstrating the relation between power and volume for folks not familiar with the logarithmic nature of it. I usually put a disclaimer on it when I share it.
 

Pogre

Active Member
Joined
Mar 5, 2022
Messages
209
Likes
257
I'll try an analogy. Say you need exactly 100 ml of water for something, like a plant. Does it matter if you get it from a 1 liter pitcher or a 10 liter bucket? Will the plant grow faster or better if the water came from the bigger bucket? No, and in either case the extra water in both containers just sits, completely unused until needed.
 

gnarly

Major Contributor
Joined
Jun 15, 2021
Messages
1,042
Likes
1,483
Maybe an easy way to see if you amp clips, is with REW's SPL meter.
.Just note the spread between LZ peak and the main display, as volume is turned up.
When the spread decreases, peaks are getting clipped.

I'd use Leq, Z-weight, and either Fast or Slow (don't think F or S will matter for the test in mind.)

Pick a reasonably short dynamic track, and turn the Leq averaging meter on and off at beginning and end of track play.
Main display will be time integrated average. LZ peak should be the highest peak within the track.

Start with a low-ish average SPL and mark what the spread is.... increasing SPL with another run ...spread should stay the same.....and again until it doesn't.

There most likely be the clipping point, i do think.
If your mic is calibrated, how does the average SPL at that point compare with speakers rated sensitivity and the amp's power rating?

make sense?
 

Aerith Gainsborough

Addicted to Fun and Learning
Joined
May 4, 2020
Messages
855
Likes
1,282
Maybe an easy way to see if you amp clips, is with REW's SPL meter.
.Just note the spread between LZ peak and the main display, as volume is turned up.
When the spread decreases, peaks are getting clipped.
Possibly.
Or you could run into compression from your speaker drivers.
The effect on the spread would be pretty much the same.

The only way to reliably detect early clipping is with an Oscilloscope.
 

gnarly

Major Contributor
Joined
Jun 15, 2021
Messages
1,042
Likes
1,483
Possibly.
Or you could run into compression from your speaker drivers.
The effect on the spread would be pretty much the same.

Excellent. I was pondering what the spread would look like under compression.

Maybe it even widens??.....
with limited current drawing the average SPLeq lower , vs transient peaks that still maybe get through at peak. when not under current draw constriction .......

....simply dunno ...

The only way to reliably detect early clipping is with an Oscilloscope.
Totally agree that scope is the (only) way to view peaks. Been making many scope, tone bursts, measurements lately.

Peaks are easy, but I haven't found any scope measurements yet, that do a decent job of averaging, or rather integrating a time constant, like SPL meters do...
Any pointers here ?

Iow, other than peak voltage.......how do we equate scope traces to any common SPL meas?
 
D

Deleted member 46664

Guest
Excellent. I was pondering what the spread would look like under compression.

I hope you don't mind if I jump in here....

Totally agree that scope is the (only) way to view peaks. Been making many scope, tone bursts, measurements lately.

Peaks are easy, but I haven't found any scope measurements yet, that do a decent job of averaging, or rather integrating a time constant, like SPL meters do...
Any pointers here ?

Clipping is not an average or integration ... it is an immediate effect, right down to half cycles of the waveform. On music with some dynamic range, an average might show you a low reading, even though serious clipping is already under way.

You need an oscilloscope directly connected to the outputs of your amplifier so you can see the output waveform. This shows what a scope will show you... This only happens at maximum amplifier power. Notice that the tops of the waveform a simply not there anymore...

main-qimg-bd2e19efecf15d142a1b76a4b01718ff


You're not going to track this with tone bursts or a microphone or a level meter. You need an oscilloscope to see it.

The more severe the clipping the more of the musical wave form is driven into pseudo-square waves until finally all of the signal is clipped... at which time you're very likely to exceed the power handling of your tweeter, even with a lower powered amplifier.

Iow, other than peak voltage.......how do we equate scope traces to any common SPL meas?

You don't.
 
Last edited by a moderator:

NTK

Major Contributor
Forum Donor
Joined
Aug 11, 2019
Messages
2,738
Likes
6,077
Location
US East
Wonderful. Below is your post #87, and now you reference an article that uses clipping of single frequency sine waves in the "analysis"... and I was being misleading in using test tones? :rolleyes:
Aren't your tests here a bit misleading in that you used test tones vs full frequency content represented by music?
Now, the problem with the analysis in your reference is that it isn't quite complete. Its author made his "conclusion" without fully completing his analysis, which is to run some numbers and show the amount of power in the harmonics generated by the clipping. He just lazily presumed the harmonics will be highly hazardous to tweeters.

Here is figure 2 from the article. Let me take for example the point at Vp/Vc = 2. The amplitude of H3 looks to be about 0.27 from the figure. So, the power of H3 will be 7.3% of a signal with an amplitude of 1 (assuming the impedance are roughly flat with frequency). The higher harmonics (H5, H7 ... etc.), as can be seen from the figure to be all < 0.1, give negligible contributions and are ignored.
fig2.gif


What the author failed to consider is that, if the amplifier doesn't clip, the unclipped signal will have an amplitude of 2, which means 4X power of a signal with amplitude of 1.

To summarize, with the amplifier clipping at Vp/Vc = 2, higher harmonics of ~0.073 units of power are created (and are presumably all sent to the tweeter). However, if there is no clipping, the power to the woofer is 4 units. Therefore, if clipping will fry this speaker but it is OK with unclipped signal, that means its tweeter will have to have <2% the power handling capability of the woofer. And this is using a "misleading" test signal with contrived conditions to give the worst case scenario.
 
Last edited:

antcollinet

Master Contributor
Forum Donor
Joined
Sep 4, 2021
Messages
7,950
Likes
13,493
Location
UK/Cheshire
Wonderful. Below is your post #87, and now you reference an article that uses clipping of single frequency sine waves in the "analysis"... and I was being misleading in using test tones? :rolleyes:

Now, the problem with the analysis in your reference is that it isn't quite complete. Its author made his "conclusion" without fully completing his analysis, which is to run some numbers and show the amount of power in the harmonics generated by the clipping. He just lazily presumed the harmonics will be highly hazardous to tweeters.

Here is figure 2 from the article. Let me take for example the point at Vp/Vc = 2. The amplitude of H3 looks to be about 0.27 from the figure. So, the power of H3 will be 7.3% of a signal with an amplitude of 1 (assuming the impedance are roughly flat with frequency). The higher harmonics (H5, H7 ... etc.), as can be seen from the figure to be all < 0.1, give negligible contributions and are ignored.
View attachment 201285

What the author failed to consider is that, if the amplifier doesn't clip, the unclipped signal will have an amplitude of 2, which means 4X power of a signal with amplitude of 1.

To summarize, with the amplifier clipping at Vp/Vc = 2, higher harmonics of ~0.073 units of power are created (and are presumably all sent to the tweeter). However, if there is no clipping, the power to the woofer is 4 units. Therefore, if clipping will fry this speaker but it is OK with unclipped signal, that means its tweeter will have to have <2% the power handling capability of the woofer. And this is using a "misleading" test signal with contrived conditions to give the worst case scenario.
Even with a 35 year electronics career (literally) behind me, I have (until this thread) just believed the "accepted wisdom" that clipping is dangerous for speakers.

I just love how much I continue to learn here.
 

NTK

Major Contributor
Forum Donor
Joined
Aug 11, 2019
Messages
2,738
Likes
6,077
Location
US East
Even with a 35 year electronics career (literally) behind me, I have (until this thread) just believed the "accepted wisdom" that clipping is dangerous for speakers.

I just love how much I continue to learn here.
I am no different from you. I had accepted the "accepted wisdom" too (see my Mar 2020 post here). I got corrected 3 posts later. So I also learned it here, just a little earlier than you :)
 

antcollinet

Master Contributor
Forum Donor
Joined
Sep 4, 2021
Messages
7,950
Likes
13,493
Location
UK/Cheshire
I am no different from you. I had accepted the "accepted wisdom" too (see my Mar 2020 post here). I got corrected 3 posts later. So I also learned it here, just a little earlier than you :)
This site/forum is an incredibly valuable resource. Not only educational value - even for experienced technologists, but also real pound notes in pockets value from improved purchase decisions.

This will probably come across as sycophancy, but @amirm you should be very proud of what you have created here. Please don't ever stop doing it.
 

RayDunzl

Grand Contributor
Central Scrutinizer
Joined
Mar 9, 2016
Messages
13,257
Likes
17,250
Location
Riverview FL
How does clipping in the source fit into the "blow your tweeters" problem?

1650531398219.png
 
Top Bottom