I hope the OP doesn't mind, but I modified his diagram with a couple of extra target curves.
I think I must be losing my mind or my hearing. Because my preferred target curve is: none of these.
View attachment 302597
Up till recently, I have only been performing DSP correction up to the Schroder frequency. After a bit of discussion with Dr. Uli Brueggemann (author of Acourate) and a bit of reading, it turns out that a lot of effort has been made to avoid deleterious effects of unwanted full range correction on speakers via psychoacoustic filtering, complex smoothing, and so on. Since it costs me nothing to implement a full range correction, I decided to do so.
These are my listening impressions:
-
Flat downward tilt. I made these at a range of slopes: -2dB, -4dB, and -6dB. The -6dB I did not like at all, it sounded too thick, had too little top end, and waaaaay too much bass. The -2dB sounded too bright (as you would expect, because it is almost a flat line). The -4dB was a happy medium, and it sounded OK ... but still too much bass.
-
B&K. This was just unpleasant on my system. Sounded too bottom heavy.
-
Harman / HATS: grouped them both together because they are similar. Harman has more bass impact and a real physicality to it, but certain instruments (notably piano and cello) sounded unbalanced with an overly exaggerated bottom end. HATS has no top end sparkle and sounded dull. Great bass though.
-
Toole / Olive: probably ranked 2nd in terms of preference, behind the straight -4dB flat downward tilt. But still too much bass.
So, by the end of the above experiment, I was dumbfounded. WHY is it that a straight downward tilt of -2dB sound too bright, but a downward tilt of -4dB have too much bass? This lead to more iterations of the Toole/Olive filter (shown in green in the above graph) where I subjectively adjusted the amount of bass and treble to my liking.
Much to my shock and horror, I ended up with this as the best sounding curve:
This is the inverse of every known curve on the planet and all published research! Anybody who looks at this curve will think that the result should sound like a tin can! But it does not - to my ears, it sounds balanced, smooth, and with the right amount of bass to give some weight to instruments but without sounding heavy or thick. As my wife said (about some of the other target curves) - "it sounds as if the pianist was playing with the pedal all the time". I would agree. With this curve, it does not - piano notes are crisp and have a satisfying weight.
So this made me wonder whether my microphone or mic preamp was faulty and cutting off the high end (which would lead to this subjectively preferred target curve). I pulled out my Behringer ECM8000 and it gave the exact same measurement as my Earthworks M30. I ran a calibration through the RME interface - it was flawless.
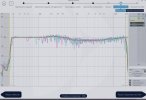
Could there be a problem with Acourate? I took a verification measurement with REW:
I kept the graphs at the same scale to make them easier to compare. As you can see, they look the same.
Obviously, the last variable in this question is whether there could be something wrong with me. Has my idea of "good sound" changed so much that I now prefer such an unbalanced curve? To be honest, I am not sure. I pulled out my DCA Stealth headphones (which are known to comply with the Harman curve for headphones), and I still think they sound dull and lacking in the top end. So perhaps the problem really is with me - maybe hearing loss, maybe I am an outlier when it comes to taste. I don't know.
Anyway, as with all new filters, I need to listen more extensively and throw different types of music at it to see if it really works. These filters were generated last night, and I had a 2 hour listening session before it was lights off for me. But so far, it really does seem to work. I have a strong bias for me to
not want this curve to work. I would rather think that this preference was due to the selection of music I threw at it rather than the more frightening prospect that I may be developing high freq hearing loss, which would require a massive treble boost to restore natural sounding sound.
I have asked a friend to implement the same curve on his system, and I will be going over in the next few days to find out if it works on his speakers, or whether it makes his system sound like a tin can. And I will be soliciting some opinions as to whether other people think this curve on my system sounds balanced or not. I will think about visiting an audiologist

I do not think I am some kind of audio genius who has stumbled across a new target curve that has been missed by all the leading researchers in this field. It is far more likely that there is something very, very wrong with my system or with me.
Also, those of you who want to replicate the target curve (and who are using Acourate), inbox me with your email address and I will be happy to send my Target.tgt file to you.