You seem to be missing the obvious. Given that the room/speaker completely dominates the response below transition, the speaker designer can only do so much, perhaps a "best guess' as to what the exact roll off/shape should be. Regarding what you can/can't hear with "hideous" bumps is another matter entirely, at best, yet another confounder not in the domain of speaker designer. No one sensible argues against EQ below the transition frequency where room and placement dominates.Many of the comments keep referring to the specific measured response for particular speakers in particular rooms. Of course I know these are filled with many hideous looking bumps that are nevertheless, not that audible (I've made measurements - I was horrified the first time)!
What I was hoping for was a discussion, and perhaps general consensus, on (approximately) what speaker designers should be aiming for at the bass roll-off of the main speakers?

-
WANTED: Happy members who like to discuss audio and other topics related to our interest. Desire to learn and share knowledge of science required. There are many reviews of audio hardware and expert members to help answer your questions. Click here to have your audio equipment measured for free!
You are using an out of date browser. It may not display this or other websites correctly.
You should upgrade or use an alternative browser.
You should upgrade or use an alternative browser.
Why is Weak Bass recommended here?
- Thread starter -Matt-
- Start date
- Thread Starter
- #82
You seem to be missing the obvious. Given that the room/speaker completely dominates the response below transition, the speaker designer can only do so much, perhaps a "best guess' as to what the exact roll off/shape should be. Regarding what you can/can't hear with "hideous" bumps is another matter entirely, at best, yet another confounder not in the domain of speaker designer. No one sensible argues against EQ below the transition frequency where room and placement dominates.
I don't miss that fact, I acknowledged it in my previous post. Nor do I argue against EQ. However speaker designers still have to aim for something.
The answer that in each case it is just a "best guess" isn't very satisfying from a scientific point of view. I was hoping for better.
What I was hoping for was a discussion, and perhaps general consensus, on (approximately) what speaker designers should be aiming for at the bass roll-off of the main speakers?
I.e. A hypothetical target - a dashed line that averages out all those room interaction bumps.
Perhaps a few different curves for different room size scenarios.
Different target curves based on whether subs will be present or absent.
But it looks as though maybe the naive crossover curves I posted from REW may be as close as we get.
(Does it even make sense that those crossover curves have a 24dB/octave slope or should instead they be 12dB/octave)?
Some are arguing that the ideal bass response is:
* For a domestic property (with smaller rooms) - the predicted in-room response shown by the Kef R3
* For a treated studio - the predicted in-room response shown by a Genelec 8361
If those statements are true then I'd like to understand further why that might be the case.
How have Kef and Genelec arrived at those optimal responses?
What assumptions have they made about the room in each case?
This is a completely different, and quite interesting discussion.
It's first perhaps important to note that you have talked a lot about crossover to subwoofer. Most speakers are not designed for this at all, they are designed to play stand alone. So that situation will typically be what most speaker manufacturers primarily design for.
That aside, there's a pretty general concensus that a flat, even anechoic response is preferrable. This holds true for the entire response, also below 100hz, until you are unable to maintain it anymore due to speaker roll-off. From there, passive sealed speakers will typically roll-off at 12db/octave (which usually matches room gain well), while a bass reflex speaker will roll off at 24db/octave below the tuning frequency. If that tuning frequency is at around ~34-35hz or below, you will typically get close to full range in-room response.
Some (including myself and based on a discussion here on ASR, also Kef and probably some others) think that an EVEN response is important, but it may not actually be the best for every speaker design that it is FLAT (as in not tilted). In my opinion a slightly elevated anechoic response from the midbass and until you start to get help from room gain is actually preferred for a natural, balanced in-room sound. So our speakers have a 1-2dB tilt starting from around 500hz and rising towards the roll-off point. This will give more energy in the mid bass area, where most rooms are hampered by SBIR effects and severe dips, giving a too lean in-room sound.
What to do if you don't accept the consensusWhat I was hoping for was a discussion, and perhaps general consensus, on (approximately) what speaker designers should be aiming for at the bass roll-off of the main speakers?

Admittedly the question is valid, but already answered me thinks. You may want to consider to move on to focus on (bass) output capability, which at least with two-ways affects midrange also--and is not yet part in the preference ranking!
You can ask @jackocleebrown if he wants to spend his time arguing with random people on the internet.I'm interested in why Kef think it is optimal to have such a shelf - and it makes an interesting backdrop for the overlays. (I'm not bashing the R3 - you seem overly sensitive about it)!
The edge of the shelf at 40Hz doesn't look ideal to me because it looks like it will need over 16dB of attenuation from the EQ system in order to allow it to smoothly blend with a theoretically ideal sub using an 80 Hz crossover. This level of attenuation may be beyond some EQ systems. (Cynically, however, it does allow them to claim a much lower -6dB point in their specs).
Good luck with your guessing what that "something" isI don't miss that fact, I acknowledged it in my previous post. Nor do I argue against EQ. However speaker designers still have to aim for something.
The answer that in each case it is just a "best guess" isn't very satisfying from a scientific point of view. I was hoping for better.
- Thread Starter
- #87
This is a completely different, and quite interesting discussion.
It's first perhaps important to note that you have talked a lot about crossover to subwoofer. Most speakers are not designed for this at all, they are designed to play stand alone. So that situation will typically be what most speaker manufacturers primarily design for.
That aside, there's a pretty general concensus that a flat, even anechoic response is preferrable. This holds true for the entire response, also below 100hz, until you are unable to maintain it anymore due to speaker roll-off. From there, passive sealed speakers will typically roll-off at 12db/octave (which usually matches room gain well), while a bass reflex speaker will roll off at 24db/octave below the tuning frequency. If that tuning frequency is at around ~34-35hz or below, you will typically get close to full range in-room response.
Some (including myself and based on a discussion here on ASR, also Kef and probably some others) think that an EVEN response is important, but it may not actually be the best for every speaker design that it is FLAT (as in not tilted). In my opinion a slightly elevated anechoic response from the midbass and until you start to get help from room gain is actually preferred for a natural, balanced in-room sound. So our speakers have a 1-2dB tilt starting from around 500hz and rising towards the roll-off point. This will give more energy in the mid bass area, where most rooms are hampered by SBIR effects and severe dips, giving a too lean in-room sound.
Is it correct that the "flat, even anechoic response" translates to the sloping downward response seen in the predicted in-room measurements?
Would you be able to sketch or show the target curve with the elevated mid-bass that you mention? Or are the following near enough...
Both curves have a slope of 1dB/octave above 500Hz (I've assumed that an approximately 1dB/octave slope, across the whole range, occurs when you convert from anechoic to predicted in-room). (The target curves above would be intended to be applied to the in-room response rather than the anechoic one).
Below 500Hz, since you state a 1 - 2 dB slope I've added an additional slope of 1.5dB/octave to the 1dB/octave from conversion to PIR. This gives a 2.5dB/octave slope to the roll-off to (hopefully) show how it would appear on the predicted in-room graph. (Is this what you intended)?
The red curve is supposed to show your suggested target for a bass reflex, passive speaker, intended to be used full range with a bass roll-off at 20Hz.
The green curve shows a similar speaker's response, but this time it is intended to be used with a sub crossed at 80Hz.
(Is this approximately the target that you would use for such a speaker)?
What additional considerations might make you modify the target (particularly in the design intended for use with a sub)?
Last edited:
Is it correct that the "flat, even anechoic response" translates to the sloping downward response seen in the predicted in-room measurements?
Would you be able to sketch or show the target curve with the elevated mid-bass that you mention? Or are the following near enough...
View attachment 278980
Both curves have a slope of 1dB/octave above 500Hz (I've assumed that an approximately 1dB/octave slope, across the whole range, occurs when you convert from anechoic to predicted in-room). (The target curves above would be intended to be applied to the in-room response rather than the anechoic one).
Below 500Hz, since you state a 1 - 2 dB slope I've added an additional slope of 1.5dB/octave to the 1dB/octave from conversion to PIR. This gives a 2.5dB/octave slope to the roll-off to (hopefully) show how it would appear on the predicted in-room graph. (Is this what you intended)?
The red curve is supposed to show your suggested target for a bass reflex, passive speaker, intended to be used full range with a bass roll-off at 20Hz.
The green curve shows a similar speaker's response, but this time it is intended to be used with a sub crossed at 80Hz.
(Is this approximately the target that you would use for such a speaker)?
What additional considerations might make you modify the target (particularly in the design intended for use with a sub)?
I didn't state a 1-2dB/octave slope, but a 1-2dB rise (from flat) towards the lower frequencies (in contrast to flat all the way).
Incidentally our speakers are designed from scratch to be used with subwoofers, so the roll-off is designed to be mated with a subwoofer that has a 100hz crossover (24db/octave).
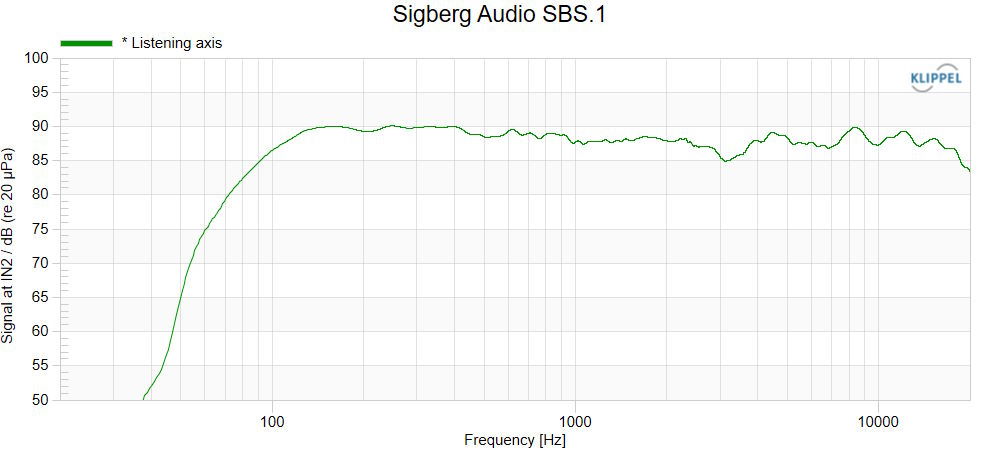
Here's one of our speakers: (anechoic measurement, listening axis)
Here's an anechoic response of speakers + sub:
And here's what that (sub+speakers) may look like in-room (0,9db/oct slope up to 100hz, where it intentionally flattens out):
- Thread Starter
- #89
I didn't state a 1-2dB/octave slope, but a 1-2dB rise (from flat) towards the lower frequencies (in contrast to flat all the way).
Thank you for the clarification, and sorry for the misunderstanding between slope per octave and total rise.
Last edited:
- Thread Starter
- #90
Incidentally our speakers are designed from scratch to be used with subwoofers, so the roll-off is designed to be mated with a subwoofer that has a 100hz crossover (24db/octave).
Here's one of our speakers: (anechoic measurement, listening axis)
Here's an anechoic response of speakers + sub:
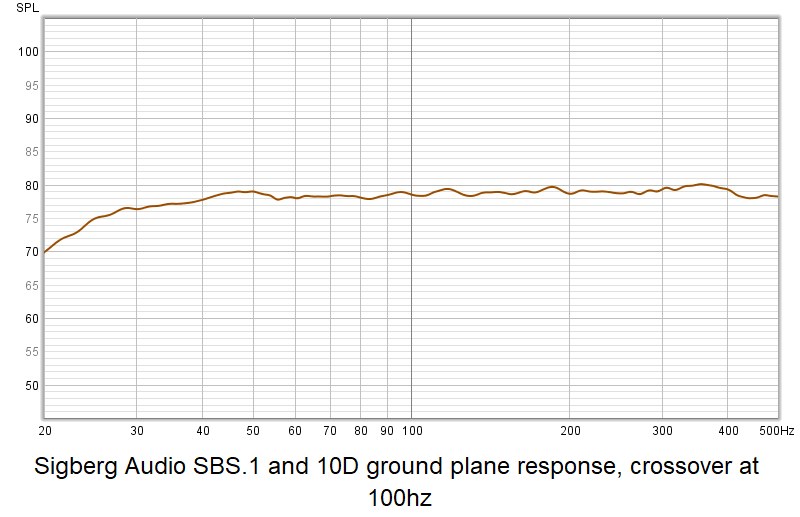
And here's what that (sub+speakers) may look like in-room (0,9db/oct slope up to 100hz, where it intentionally flattens out):
View attachment 279009
The (anechoic) bass roll-off of the SBS.1 looks as though it would fit very closely with one of those REW target crossover curves I posted earlier. (Especially after the slight tilt added in the case of the in-room measurements).
I don't want to probe too deeply into your design choices in case there are aspects that you prefer to keep secret, however, I'm curious about the decision to cross at 100Hz. Do you perhaps consider this beneficial for the mid frequencies? Or is it perhaps done with a particular sub in mind?
Do you see any potential benefit in the Kef type bass shelf/hump discussed earlier?
Last edited:
The (anechoic) bass roll-off of the SBS.1 looks as though it would fit very closely with one of those REW target crossover curves I posted earlier. (Especially after the slight tilt added in the case of the in-room measurements).
I don't want to probe too deeply into your design choices in case there are aspects that you prefer to keep secret, however, I'm curious about the decision to cross at 100Hz. Do you perhaps consider this beneficial for the mid frequencies? Or is it perhaps done with a particular sub in mind?
Do you see any potential benefit in the Kef type shelf discussed earlier?
The crossover is actually with a bit of overlap. Our speakers have a -3dB point at 90hz, while our subwoofers have a preset designed for the speaker that roll off at 100hz. This gives a smooth transition, high capacity / dynamic headroom while still being so low that localization won't be an issue in most situations. In practice crossing a sub towards our speakers as low as 80hz works well in most cases too, as you can compensate with a bit higher gain on the sub.
KEF:
I don't want to speculate or comment too much about the Kef design. The shelf is a consequence of the combination of the woofer output and the port output, and the result of the port extending the response of the woofer.
There's no one answer because from the speaker designer's point of view the low-end response in-room must be treated as essentially random. As you noted, it depends on the intended application, but also the taste of the user.general consensus, on (approximately) what speaker designers should be aiming for at the bass roll-off of the main speakers?
So that's the thing, it could be either one, neither is considered less valid than the other, they correspond to different speaker design principles. You trade off extension for slope in sealed vs. ported. There are other trade-offs involved with that choice, too - group delay for one.(Does it even make sense that those crossover curves have a 24dB/octave slope or should instead they be 12dB/octave)?
As a rule of thumb, you want the lowest roll-off you can get, but there is no one exact right answer for bass, because rooms vary so much.
Yes, it does. A sealed enclosure is described by therory as a 2nd order highpass in its own. The 2nd order is discribed by the filter frequency fx and a Q-factor., e/g Butterworth: Q=0.707, Linkwitz/Riley (preferred) Q=0.500.... it could be either one, neither is considered less valid than the other, they correspond to different speaker design principles. ...
Sub needs 4th order. Take sealed enclosure with Q=0.707, add (better: from a system view multiply!) another filter with same fx and so Qs combine 0.707^2 = 0.500 results in overall Linkwitz/Riley 4th order.
(Sidenote: in general 4th order is described as two 2nd order combined which don't need to have the same fx'es or Qs)
With ported it's more difficult, because the reflex makes it a 4th order for its own, so how to combine with an electr/ filter to reduce excursion?!
I won't pick on anyone, but does it make sense to discuss all this without?
Again, my suggestion is to conclude, that bass management is left to the consumer's imagination. Predictions are more or less worthless. Only that room gain will be there, so bass can be delivered a little bit muted with benefit. A shelf is more tolerant than a sharp roll-off. Please contact a competent person if you mind to learn about this stuff, allow someone else to earn his living.
ROOSKIE
Major Contributor
What the designer is aiming for in a performance oriented design is surely a variation of accurate sound and a design that simultaniously ensures sales happen. All great designs have their pro and cons, their gives and takes. These products are for sale in a very wide market.I don't miss that fact, I acknowledged it in my previous post. Nor do I argue against EQ. However speaker designers still have to aim for something.
The answer that in each case it is just a "best guess" isn't very satisfying from a scientific point of view. I was hoping for better.
Reguarding 'best guess' disappointment. I'd say you either need to learn how to fully tune your system yourself in the exact situation it will be used or hire someone who can.
All of this loudspeaker engineering is a best guess, especially retail shelf. What is the highest probability of success? That is science bud, at some point you have to just decide. You look at your stats and data and make a choice. No medicine works 100% of the time no weather forecast is ever 100% correct no speaker is going to behave in 100% predictable fashion in your room.
Like custom shoes and suits, if you are after a personal fit prepare to pay the right person for it or take cobbling courses.
The great things is that there is so much an interested hobbiest and a DIY person can do. WIth a bit of study(well maybe a lot of it) and the right gear you can really tune your system to measure and sound exceptional and even make super good ground up systems if you have the time and space to devote.
I am not @sigbergaudio but I personally like 100hrz if clean high output is the goal (higher if the transition is to a smaller than 6.5' woofer).The (anechoic) bass roll-off of the SBS.1 looks as though it would fit very closely with one of those REW target crossover curves I posted earlier. (Especially after the slight tilt added in the case of the in-room measurements).
I don't want to probe too deeply into your design choices in case there are aspects that you prefer to keep secret, however, I'm curious about the decision to cross at 100Hz. Do you perhaps consider this beneficial for the mid frequencies? Or is it perhaps done with a particular sub in mind?
Do you see any potential benefit in the Kef type bass shelf/hump discussed earlier?
Take a 2way 6.5" based monitor speaker.
I like keeping excursions down on the 6.5".
A 80 hrz crossover gives little practical benefit in terms of subwoofer isolation vs 100hrz.
It also will work well with many contemporary 6.5" woofers in a small sealed box. If I am crossing to subs, I can use a much smaller sealed box 2-way monitor as I don't need the monitor to reach 40hrz. Now that speaker will always need subs but it can be much smaller and since it is sealed there are no port related issues. A lot of woofers in said small sealed box will have -3db down points around 70-100hrz.
The bass shelf KEF is using is a design strategy and not new or particularly unusual. The main benefit is bass extension. There is also some cone excusion control. They could have probably could have tuned that woofer in that box differently and given up some extension for less of a shelf. Or they could use a larger enclosure and give up output ability and SPL with bass heavy stuff. The woofer appears to have a low resonant frequency however that is only a 6.5".
Well, so that is the basic trade ---->extra extension for a shelved responce.
At any rate I honestly think you currently are overfocused on the exact graphs and exact numbers and exactly how lines are drawn out. I get that it looks good 'on paper' that way but from my view that isn't really engineering. There surely is much more flexibility in engineering. Have you tried designing some speakers -even hypotetical ones? You might enjoy it. The process and the research in books and DIY forums is a rabbit hole for sure. It will teach a lot about what you seem to be interested in. At the very least really spend time playing with what you have, especially messing around alot with PEQ/DSP/RC and blending subs into both high passed and full range speakers in different ways with different settings.
Isn't the crossover to a sub pretty debatable? Some prefer a 4th (or higher) order crossover to save the mains from having to reproduce low frequencies. Some prefer a slow crossover to the sub (or even just uncontrolled overlap, with room EQ to control the response instead) to use more sources for low frequencies and try to compensate for room modes that way.Sub needs 4th order. Take sealed enclosure with Q=0.707, add (better: from a system view multiply!) another filter with same fx and so Qs combine 0.707^2 = 0.500 results in overall Linkwitz/Riley 4th order.
Sure, but there is at least some 'surround' standard that demands a certain x-over. Which I don't know.I wanted to outline what the x-over is about, namely a composition of the enclosure's inherent filter function multiplied with external filter(s).Isn't the crossover to a sub pretty debatable? Some prefer a 4th (or higher) order crossover to save the mains from having to reproduce low frequencies. Some prefer a slow crossover to the sub (or even just uncontrolled overlap, with room EQ to control the response instead) to use more sources for low frequencies and try to compensate for room modes that way.
What I didn'd explicate again was the phase relation's contribution, given placements and listening position(s). I think it is all to complicated for a layman. Experimentation is o/k, though. But not a generalized prediction ;-)
If those statements are true then I'd like to understand further why that might be the case.
How have Kef and Genelec arrived at those optimal responses?
What assumptions have they made about the room in each case?
Jack Oclee Brown from Kef talks about the two tunings possible in the Reference series in this interview, starting at 27:49, and talks about the issues of trying to match unknown rooms in different countries - I think that will go along way to answering your question, although I think others here have already covered most of it.
What the designer is aiming for in a performance oriented design is surely a variation of accurate sound and a design that simultaniously ensures sales happen. All great designs have their pro and cons, their gives and takes. These products are for sale in a very wide market.
Exactly. I cannot keep thinking that these bois have been designing and selling speakers for 50 years, with great reviews and sales.
And now bunch of chumps in internet forum should figure a better way for them to design speakers? Let's give them a call when a consensus has been reached, it's about time for them to step up their game!
High passing the speakers and using a subwoofer (which you can then adjust in volume and potentially eq) is also a good solution to better match the bass output to the room. Then you are less dependent on finding a speaker which happen to match the room with regards to bass tuning.
I strongly suspect that what you have been seeing in your example anechoic measurements is the general consensus from speaker designers on what they should be aiming at for bass roll-off.What I was hoping for was a discussion, and perhaps general consensus, on (approximately) what speaker designers should be aiming for at the bass roll-off of the main speakers?
Similar threads
- Replies
- 49
- Views
- 3K
- Replies
- 4
- Views
- 1K
- Replies
- 21
- Views
- 2K
- Replies
- 50
- Views
- 3K
- Replies
- 299
- Views
- 55K