
I would like to understand how to interpret a directivity error from the measurements and most importantly what exactly is a directivity error?
Am I right in understanding that its a mismatch between a conformed controlled dispersion between the two different frequency ranges at one point throuought the spectrum? Or particularly at the crossover region...?
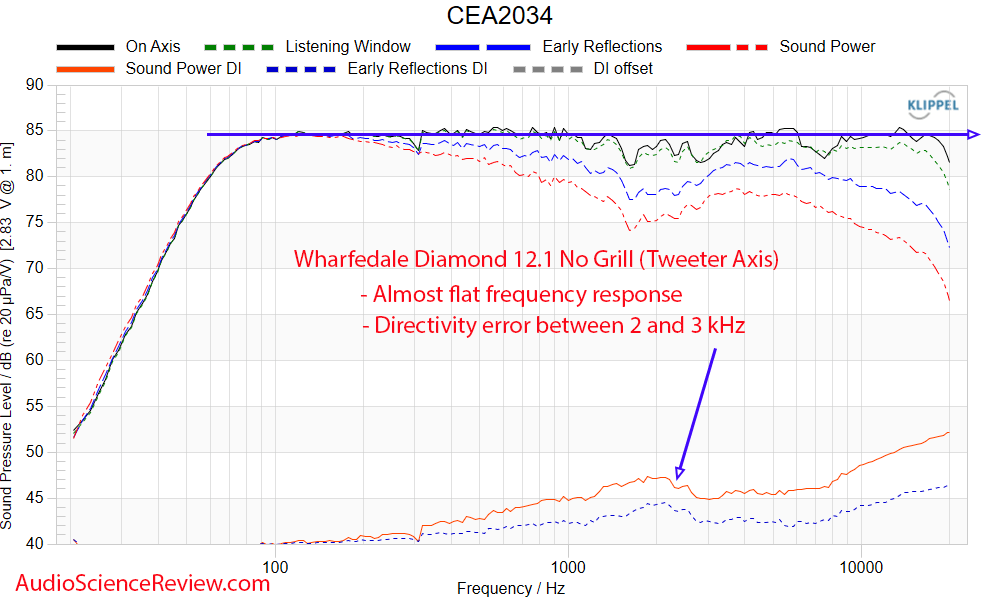
Secondly, Amir points it out on the graph but what am I looking at exactly and is the measurment tellling me what the error is or I can only identify it...? To be honest, I do not even know what the bottom red line on the graph is.
Am I right in understanding that its a mismatch between a conformed controlled dispersion between the two different frequency ranges at one point throuought the spectrum? Or particularly at the crossover region...?
Secondly, Amir points it out on the graph but what am I looking at exactly and is the measurment tellling me what the error is or I can only identify it...? To be honest, I do not even know what the bottom red line on the graph is.
