• WANTED: Happy members who like to discuss audio and other topics related to our interest. Desire to learn and share knowledge of science required. There are many reviews of audio hardware and expert members to help answer your questions. Click here to have your audio equipment measured for free!

Trying to make sense of digital room correction results

vco1

Active Member
Joined
Jun 9, 2021
Messages
155
Likes
153
I just did my first measurement with the HifiBerry Digi2 Pro with DSP Add-on. The process was smooth (but noisy ;-)). And the result sounds okay. With the note that I haven't done any thorough listening yet.
However, when I had a look at the profile that was generated, I was a bit surprised. Note that I don't know much about PEQ and room correction. So this may be due to lack of knowledge.
Screenshot 2022-09-16 at 14.46.16.png
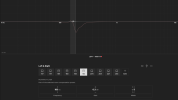
As can be seen in the image, there are 3 frequencies with 2 or more filters each: 147Hz, 183Hz and 204Hz. They have different Gain settings, but the same (per frequency) Q and filter type.
Is this ok? Why three filters for the same frequency and not just one? Would like to understand what's the reason for this. If there is a reason.
 

NTK

Major Contributor
Forum Donor
Joined
Aug 11, 2019
Messages
2,703
Likes
5,956
Location
US East
I don't have any actual experience with HiFiBerry OS. These are just my "educated" guesses based on what I gathered from their info on GitHub.
These are from their GitHub example. Here are the input to the optimizer. Note that there are only 11 measurement points, from 20 Hz to 20480 Hz, 1 octave spacing (each point doubles the frequency of its previous one). In this case, the input file specifies generating 10 filters, with the "add_highpass" option activated. Target curve is flat.

hifi_berry_1.jpg

These are the output from the optimizer. The first filter is the 80 Hz high pass filter, Q 0.5, (2nd order Linkwitz-Riley). It is followed by 9 parametric filters, thus totally the specified total of 10 filters. See that the center frequencies of the parametric filters are "restricted" to the measurement frequencies. Several filters have repeated center frequencies.

hifi_berry_2.jpg

From this example I deduce that the optimization uses a commonly used algorithm which starts by looking for the biggest deviation (peak or dip) in the frequency response, optimize a 2nd order parametric filter (biquad) to correct for the deviation, then compute the corrected frequency response. It then runs the same optimization again to compute the second filter, and then the third, and stops after the 9th. Therefore, if the uncorrected response has a small number of large bumps/dips, the optimization algorithm may return to them for further corrections (since a single 2nd order filter is not capable of fully correcting an arbitrarily shaped bump/dip). Since the default number of filters seems to be 10, the optimization will give 10 filters, even when fewer are fully sufficient.

HTH
 

voodooless

Grand Contributor
Forum Donor
Joined
Jun 16, 2020
Messages
10,351
Likes
18,200
Location
Netherlands
Nice description!

It however does not match what the picture shows. It has multiple corrections for the same frequencies, yet 10 in total.

Some bug possibly? For me the auto correction never worked on HifiBerry, but mostly because the measurement was totally wrong for some reason.
 

NTK

Major Contributor
Forum Donor
Joined
Aug 11, 2019
Messages
2,703
Likes
5,956
Location
US East
I think in OP's screenshot the PEQ's seem to be sorted by frequency, and the frequency range is limited to below Schroeder. In the GitHub example, the PEQ list is sorted by "importance", which is the order of the filters generated by the optimization. In the GitHub case, the last 2 filters have gains of ~0.1 dB, which will be most definitely inaudible.

In OP's case, the PEQ, shown at 183 Hz with a gain of 0.3 dB and a Q of 5, is also inaudible.
 
OP
V

vco1

Active Member
Joined
Jun 9, 2021
Messages
155
Likes
153
Thanks for your answers. They gave me some insight in what's going on. I wasn't aware that the process was based on (relatively) simple parameters.
I guess I have to do some new measurements with REW to get better results.
 
OP
V

vco1

Active Member
Joined
Jun 9, 2021
Messages
155
Likes
153
Another rather silly question. The measurement was extremely loud. So loud that I had to get out of the room. Also, the sweeps sounded like they made the whole building shake.

Does it really have to be this loud? And will it be that loud when using REW too? Could it be because my speakers are about 6m/20ft away from my listening position?

Asking because I'm living in an apartment building and felt rather ashamed when running these measurements. Even though it took only a couple of minutes. It felt like much longer. And much more intrusive than drilling holes in concrete walls e.g.

Like it was now, it's not a process that i want to repeat often.
 
Top Bottom