
DaveFred
Member
Hello,
I have seen many crossover simulations with VituixCAD, but very few with the full 360º X and Y measurements in 10º increments of each driver that Kimmo recommends.
Here are the full measurements of a sealed two way I am working on with the Dayton DA175 woofer and Seas 27TFFC tweeter.
Attached are four zip files,
27TFFC - Tweeter data (names in the zip might show 27TFF and 27TFFC, I named one set wrong, just load them all from that directory)
DA175 natural - Woofer with GHP
DA175 GHP 540uf -Woofer nearfield with Geschlossen mit Hochpass (540uf high pass filter for the woofer built into the measurement)
DA175 27TFFC ZMA - Tweeter and woofer impedance files
My suggestion is to extract them to their own folders so they are easier to find and load (and to not confuse the two sets of woofer data)
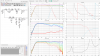
The only "distance" data to be entered into VituisCAD is "-165mm" in the Y offset for the woofer.
There is no "Z" or delay to be entered anywhere for the tweeter as the time of flight was captured with dual channel Arta measurements.
Here are a couple of different scenarios,
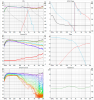
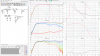
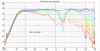
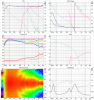
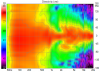
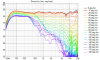
Be sure and check out all the excellent graphs that are available when you have a full data set.
Scroll through the frequency range both vertical and horizontal and look at the lobing pattern as the frequency changes.
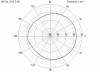
See the horizontal and vertical polar plots, line charts, graphs, etc.
There is sooo much more to explore when you have more than a simple on axis woofer/tweeter response.
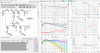
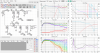
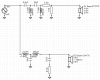
Here are a couple of XO's I have been playing around with, you can enter them and see what the full results are,
Please feel free to post any XO's you come up with as well!


I have seen many crossover simulations with VituixCAD, but very few with the full 360º X and Y measurements in 10º increments of each driver that Kimmo recommends.
Here are the full measurements of a sealed two way I am working on with the Dayton DA175 woofer and Seas 27TFFC tweeter.
Attached are four zip files,
27TFFC - Tweeter data (names in the zip might show 27TFF and 27TFFC, I named one set wrong, just load them all from that directory)
DA175 natural - Woofer with GHP
DA175 GHP 540uf -Woofer nearfield with Geschlossen mit Hochpass (540uf high pass filter for the woofer built into the measurement)
DA175 27TFFC ZMA - Tweeter and woofer impedance files
My suggestion is to extract them to their own folders so they are easier to find and load (and to not confuse the two sets of woofer data)
The only "distance" data to be entered into VituisCAD is "-165mm" in the Y offset for the woofer.
There is no "Z" or delay to be entered anywhere for the tweeter as the time of flight was captured with dual channel Arta measurements.
Here are a couple of different scenarios,
Be sure and check out all the excellent graphs that are available when you have a full data set.
Scroll through the frequency range both vertical and horizontal and look at the lobing pattern as the frequency changes.
See the horizontal and vertical polar plots, line charts, graphs, etc.
There is sooo much more to explore when you have more than a simple on axis woofer/tweeter response.
Here are a couple of XO's I have been playing around with, you can enter them and see what the full results are,
Please feel free to post any XO's you come up with as well!
")


.jpg")
.jpg")
.jpg")
.jpg")


