• WANTED: Happy members who like to discuss audio and other topics related to our interest. Desire to learn and share knowledge of science required. There are many reviews of audio hardware and expert members to help answer your questions. Click here to have your audio equipment measured for free!

The impact of high-pass filter on the step response

ppataki

Major Contributor
Joined
Aug 7, 2019
Messages
1,241
Likes
1,389
Location
Budapest
Recently I have been playing around with some high-pass filters on my system (these are my fronts and these are my rears)
For music I don't really need a high-pass filter but when I run some Dolby or DTS tests or watch a movie at high volume levels I need to apply a high-pass filter to prevent audible over-excursion of the drivers.

Now some wavelet diagrams:

1. This is how it looks like when the frequency response is ruler flat:

1661342763176.png


2. This is how it looks like when I apply a 4.5dB high-shelf from 100Hz with Q=1

The colours at the bottom moved a bit more towards red since energy in that frequency range became higher + both pre- and post ringing became a little bit higher
I guess this is all just fine
1661342820816.png


3. Now let's apply an additional high-pass filter at 23Hz with 24dB/octave:

Woow, looks pretty bad! (at least to me)
Pre-ringing is gone (need to add though that it was NOT audible at all previously either) but post-ringing just went up the roof
The energy peak has been shifted to the right by 25ms and there is still heavy oscillation till around 65ms....
1661342974081.png


4. OK, let's try the same high-pass filter but this time in linear phase mode

Another Woooow!
Now my wavelet seems a lot more like the one without the high-pass filter...
Pre-ringing is a bit less and even post-ringing became smaller (look at the colours just next to 0ms to the right)
1661343200215.png


I am not an engineer and never studied linear system theory so I would really appreciate if somebody could please explain what I see here :)

To me the linear phase diagram looks like lightyears better vs the minimum phase one but when I listen to them actually I do not hear a huge difference - I am not even sure I would pass a double blind test....

Any comments would be appreciated
Thank you

EDIT: these are all actual measurements at the MLP, they are not simulations! For the filters I used the latest version of CraveEQ (and I strongly suspect that I would have ended up with same/similar results with other solutions too)
 

GalZohar

Senior Member
Joined
Aug 8, 2021
Messages
449
Likes
218
Would be interesting to read an explanation for those results.

Are there any other filters (room EQ etc) applied to the system? Otherwise how did you get "ruler flat"? Your post implies no subwoofer, but just making sure as you didn't' specify it.
 
OP
P

ppataki

Major Contributor
Joined
Aug 7, 2019
Messages
1,241
Likes
1,389
Location
Budapest

abdo123

Master Contributor
Forum Donor
Joined
Nov 15, 2020
Messages
7,444
Likes
7,954
Location
Brussels, Belgium
Gifs makes it easier to read spectrograms btw.

A little off topic so you might wanna answer in the MCLA thread. How does excess group delay looks for the MCLA? Is it more minimum phase than regular speakers?
 

ernestcarl

Major Contributor
Joined
Sep 4, 2019
Messages
3,110
Likes
2,327
Location
Canada
In case you haven't bookmarked and seen Geoff Martin's blog series on "Filters and Ringing" yet: https://www.audiosciencereview.com/forum/index.php?threads/filters-and-ringing.36197/

Hint: after filter creation, I now always generate and/or import it into REW so I can examine it much closer...

4. OK, let's try the same high-pass filter but this time in linear phase mode

Another Woooow!
Now my wavelet seems a lot more like the one without the high-pass filter...
Pre-ringing is a bit less and even post-ringing became smaller (look at the colours just next to 0ms to the right)
1661343200215.png


I am not an engineer and never studied linear system theory so I would really appreciate if somebody could please explain what I see here :)

To me the linear phase diagram looks like lightyears better vs the minimum phase one but when I listen to them actually I do not hear a huge difference - I am not even sure I would pass a double blind test....

Any comments would be appreciated
Thank you

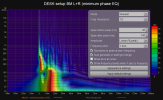
Your wavelet spectrogram settings appear to use 1/1 or 1/2 smoothing -- other end of the extreme with a heavy time bias -- and a linear (% peak) amplitude.

From what I recall, Matt Poes rates a room where the 'peak energy time' of LF bass remains under 10 ms as "excellent", and ~20 ms as still being "very good".

Beyond 40 ms, to him, is something to "avoid".

A 24dB/oct HPF for a sub doesn't seem particularly out of the ordinary or extreme; and, to my eyes, it still looks "okay-ish" in your graph. More recently, I've been using all-pass filters (increases GD) as necessary to make integration and phase profile matching a whole lot easier. Honestly, I myself feel perfectly fine using a regular 24dB/oct HPF were it not the case that I use mixed phase filters to make integration between my multiple speakers of differing phase profiles (because of mixing-and-matching different brands and types) a little bit easier.


1661363886275.png


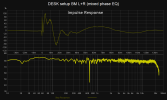
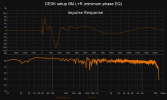
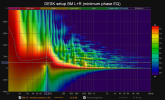
In the ff. "macro" point of view -- of my own 7.1c desk setup -- I don't really see much difference/improvement in the optimal mains+sub alignment either way. The additional "early start" at the very low frequencies caused by my partial linear phase correction in the subwoofer region, in fact, looks somewhat unnecessarily "worse" looking -- depending on who you ask.

1661362060538.png 1661362069969.png 1661362079310.png 1661362086262.png

Currently, 60 ms (or 5760 taps at 48 kHz) is about the maximum I'm willing to use in my FIR filters to keep lip sync delay under control. I feel the particular room acoustics involved and speakers' design do not make it any more possible to "correct" further than what is shown without significantly adding more pre-ringing than is acceptable.

But, more importantly, can I hear a difference in simple A/B listening tests between my optimized minimum phase and mixed phase EQ presets? Well, yes... but, at this point in time, it's still not clear to me that one is truly better than the other.
 
OP
P

ppataki

Major Contributor
Joined
Aug 7, 2019
Messages
1,241
Likes
1,389
Location
Budapest
Gifs makes it easier to read spectrograms btw.

A little off topic so you might wanna answer in the MCLA thread. How does excess group delay looks for the MCLA? Is it more minimum phase than regular speakers?
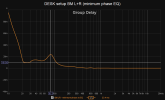
This is the GD and Excess GD for my left channel

1661364904805.png
 

ernestcarl

Major Contributor
Joined
Sep 4, 2019
Messages
3,110
Likes
2,327
Location
Canada
Isn't that just smoothing causing the difference?

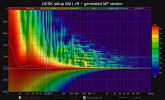
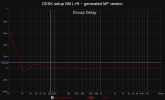
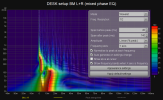
Some of it. If frequency dependent windowing were applied, some of the messiness in the given GD graphs would be cleared up, same as in the phase response. If I remember right, the default wavelet spectrogram’s “peak energy time” roughly corresponds to a *1/3 smoothed and windowed (*FDW 6) response.

It’s normally better to apply some moderate filtering when comparing graphs to make things easier to read.

In the ‘All SPL’ tab measurement options window, clicking on the ‘minimum phase version’ button will generate a new synthetic measurement giving you some idea how far your actual captured transfer function is from the ideal linear phase with a flat time response.

EDIT: rechecking my own measurements, the default wavelet spectrogram setting lines up more to roughly to 1/3 smoothing and FDW 6 cycles in the GD graph.

1661388866142.png 1661388872726.png 1661389148833.png 1661389159478.png
 
Last edited:
OP
P

ppataki

Major Contributor
Joined
Aug 7, 2019
Messages
1,241
Likes
1,389
Location
Budapest
Smoothing and FDW-ing the FR curve have no impact on the Wavelet diagram, just tried
I can change the smoothing of the Wavelet itself but it will show the same (1/3 smoothing instead of 1/1):

ezgif.com-gif-maker.gif


Would be really great to understand why this is happening
 

ernestcarl

Major Contributor
Joined
Sep 4, 2019
Messages
3,110
Likes
2,327
Location
Canada
Smoothing and FDW-ing the FR curve have no impact on the Wavelet diagram, just tried
I can change the smoothing of the Wavelet itself but it will show the same (1/3 smoothing instead of 1/1):

Would be really great to understand why this is happening

The spectrogram view mode uses its own appearance filtering, which is supposed to be completely separate from the other graph views. Although, there is sometimes a spillover effect/bug where if you filter using the other tab views it can clip the lower end of the spectrogram graph itself. Other software programs provide different filtering algorithims for their own spectrograms -- e.g. Clio

Another roundabout way is to apply filters to a measurement via main graphical view tabs/EQ window, then generating a new measurement/exporting a filtered measurement curve and re-importing it back into REW.

*Try applying a HPF to your measurement in the EQ window and then generate the predicted new measurement. You should then be able to see what effect this has on the spectrogram.
 
Last edited:

gnarly

Major Contributor
Joined
Jun 15, 2021
Messages
1,019
Likes
1,434
Recently I have been playing around with some high-pass filters on my system (these are my fronts and these are my rears)
For music I don't really need a high-pass filter but when I run some Dolby or DTS tests or watch a movie at high volume levels I need to apply a high-pass filter to prevent audible over-excursion of the drivers.


I am not an engineer and never studied linear system theory so I would really appreciate if somebody could please explain what I see here :)

To me the linear phase diagram looks like lightyears better vs the minimum phase one but when I listen to them actually I do not hear a huge difference - I am not even sure I would pass a double blind test....

Any comments would be appreciated
Thank you

EDIT: these are all actual measurements at the MLP, they are not simulations! For the filters I used the latest version of CraveEQ (and I strongly suspect that I would have ended up with same/similar results with other solutions too)
Hi, what is the actual implementation of the minimum phase and linear phase high passes? (what processor or software?)

And particularly, how many taps at what sample rate, are you using for the linear phase?
 
Top Bottom