• WANTED: Happy members who like to discuss audio and other topics related to our interest. Desire to learn and share knowledge of science required. There are many reviews of audio hardware and expert members to help answer your questions. Click here to have your audio equipment measured for free!

Step Response: Does It Really Matter?

q3cpma

Major Contributor
Joined
May 22, 2019
Messages
3,060
Likes
4,417
Location
France
Or limit phase linearisation to i.e. midbass, when pinpoint localisation at least troublesome to our earbrain and phase error will not really matter.
That's how Genelec does it, S&R shows the newer Ones (8361A and 8331A) as phase linear starting from 1 kHz, the 8350A from 300 Hz and the S360 from 100 Hz.
 
Last edited:

ernestcarl

Major Contributor
Joined
Sep 4, 2019
Messages
3,110
Likes
2,327
Location
Canada
Alternatively you can simply compensate each driver, and the crossover as well, digitally, using DSP and it all works like a charm.

In the below coax monitor, at least, it's obvious how DSP is used to "pre-flatten" the phase throughout the crossover region:

1613301632585.png
 

j_j

Major Contributor
Audio Luminary
Technical Expert
Joined
Oct 10, 2017
Messages
2,278
Likes
4,780
Location
My kitchen or my listening room.
Although drivers should be better placed geometrically in a way that their sound generation centres don't have a significant distance differences as correcting differences per DSP delay works only for one angle and compromises the generated radiation pattern and reflected sound.

One must ALWAYS start with a decently designed physical situation.

But adjusting via DSP is no different than adjusting via moving drivers, in a very real fashion. The geometry is a bit different, but it's no better or worse.

But, absolutely, bad physical layout is, well, "bad physical layout". What I can I say?
 

thewas

Master Contributor
Forum Donor
Joined
Jan 15, 2020
Messages
6,855
Likes
16,780
One must ALWAYS start with a decently designed physical situation.
With bought loudspeakers unfortunately yes, my post referred that this still isn't an optimal situation and more for the DIY community who can change the physical situation before thinking they can just correct it electronically.
 

j_j

Major Contributor
Audio Luminary
Technical Expert
Joined
Oct 10, 2017
Messages
2,278
Likes
4,780
Location
My kitchen or my listening room.
With bought loudspeakers unfortunately yes, my post referred that this still isn't an optimal situation and more for the DIY community who can change the physical situation before thinking they can just correct it electronically.


I'm sorry, what? I'm not sure I qualify as "DIY" because I design loudspeakers (among other things) professionally, but I'm having some trouble decoding your point? Who mentioned just throwing DSP at something and ignoring the physics. It can be attempted, but nothing beats physics. Nothing.
 

thewas

Master Contributor
Forum Donor
Joined
Jan 15, 2020
Messages
6,855
Likes
16,780
I'm sorry, what? I'm not sure I qualify as "DIY" because I design loudspeakers (among other things) professionally, but I'm having some trouble decoding your point? Who mentioned just throwing DSP at something and ignoring the physics. It can be attempted, but nothing beats physics. Nothing.
I didn't refer to you as DIY but as I wrote hobbyist from the DIY community who might not know that correcting the distance difference electronically can have the aforementioned problems and cannot be really a good solution for a physically ill design.
 

bennybbbx

Addicted to Fun and Learning
Joined
May 27, 2020
Messages
691
Likes
124
Location
germany
Ok. One of us does this for a living. That's me. Subsample delays are well understood, easily implemented, and documented time and time again in the literature. Your insistence on this myth is pure, 100% disinformation, and has been presented over and over, with the result that the myth of intersample resolution persists, as your false information proves conclusively.

Just give it up. You do not understand sampling, sampling theory, or signal reconstruction theory. You just do not understand what you're talking about.

http://users.spa.aalto.fi/vpv/publications/vesan_vaitos/ch3_pt1_fir.pdf

Don't let the "approximation" comment fool you, the approximation can be to any arbitrary level of accuracy that one might want.

https://www.intechopen.com/books/ap...-engineering/fractional-delay-digital-filters Read that for (*&*(&( sake instead of making elementary mistakes.

https://ieeexplore.ieee.org/document/860248 for more modern treatment.

But let me help you. Take your 44/16 signal, interpolate it to 88/16. This kind of sampling rate conversion is well known. Then, delay the 88kHz signal by 1 sample. Now, convert back to 44/16. Now you have 1/2 sample delay, to any arbitrary precision that you might wish.

Or, maybe interpolate by 128, then interpolate adjacent samples linearly, then decimate by 128. Now you can do fractional delays to the resolution of your floating point processing.

Q.E.D.

ok i understand and learn, it is possible in theory with oversampling and interpolation(which can cause quality loss) to have any delay and not limit to sample steps. but i have no delay VST plugin that delay in other as sample steps. i search for subsample delay VST and find nothing. delay plugins allow feedback and allow easy to delay only 1 channel. did you know a delay VST with that features that support subsamples ?. I find that such thinks not called delay. thiey are called phase align and have a demo

https://www.forward-audio.com/phase-alignment-plugin-fatimealign/

for subsample delay need 3 interpolations which cause errors. but i test this plugin and hear no diffrence at 44 khz.
What i want say with the period time is more that human can mostly not hear 20 khz thats period 50 microseconds. but can hear 22 microseconds delay between left and right channel. also stereo hearing and reverb happen on mid range frequency. I read that above 1.6 khz the brain do this on diffrent level and not delay between left and right diffrence.

so it is logic for good stereo reproduce, that the mid range speaker is precise and not floppy so that the transients are produce at exact times. Question is how can see a precise mid range speaker in measurement witgh REW(when the step response not show this) ?.
 

bennybbbx

Addicted to Fun and Learning
Joined
May 27, 2020
Messages
691
Likes
124
Location
germany
Sorry, but this is not correct either!
Let's consider two ideal wideband chassis (minimum phase, no excess phase). The following step responses are available for these:
A) View attachment 111095 B) View attachment 111097
Chassis A, there the voice coil comes to rest after about 2-3ms.
Chassis B, there the damped oscillation is not in a constant state even after 4ms.

The differences are caused by the different frequency transmission range of chassis A and B:
A) View attachment 111233 B) View attachment 111234

Only if the frequency transmission ranges of the chassis are completely identical, one could read off conclusions about the decay behavior of the chassis. This is unlikely to be the case in reality when comparing loudspeakers.

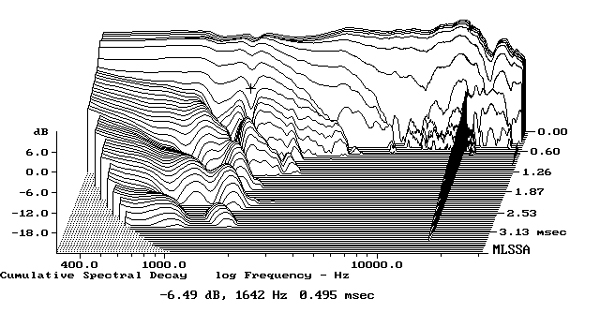
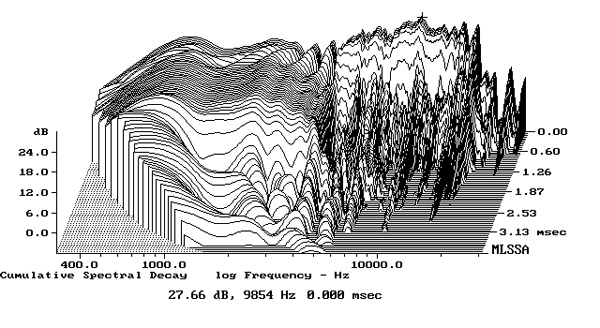
In order to be able to make a statement about the decay behavior of a loudspeaker (to get a "value if a speaker is precise"), the measured impulse response is converted into the cumulative spectral decay (with time-based or oscillation-based axis).
In this way, it is much easier to make statements about the decay behavior of loudspeakers - provided that reflections are suppressed via gate.


The same applies to the evaluation of multi-way loudspeakers on the basis of the step response.
Let's consider two ideal two-way loudspeakers with identical filter order but one with a crossover frequency of 5kHz (C) and one of 1.5kHz (D):
C) View attachment 111257 D) View attachment 111259
I don't know what the sources for your conclusions were, but if someone wants to tell you in the future that speaker C is more precise and can reproduce transients better because, for example, the woofer "reaches the maximum" faster in the step response, you know that this is nonsense.
Due to the lower crossover frequency of speaker D, there the oscillation periods of the woofer ("starting" at 1.5kHz) are longer, hence the slower rise and the "later" maximum.


On the subject stereo phantom image, width, elevation, spaciousness, envelopment,... you will find much useful information in Floyd Toole's book "Sound Reproduction" ... and no, you cannot infer the stereo image width established by loudspeakers based on the step response
.

ok, but rew seem not have cumulative spectral decay. i see decay values in REW but they seem not able to compare a fast and a slow speaker. headphone that reach low frequency is much faster as small speaker. the iloud mtm have more and lower bass as the Kali LP6 but the kali have a slower step response. the eris 3.5 have much less bass as the MTM but simular step response as the MTM. and it sound in stereo width not much diffrent to MTM. maybe the step tesponse change lots when use measure start frequency from 100 hz or form 2000 hz. but in real world speakers i see clear the small speakers are more precise. see my old post with the step resonse links to the speakers
decay.jpg
 

j_j

Major Contributor
Audio Luminary
Technical Expert
Joined
Oct 10, 2017
Messages
2,278
Likes
4,780
Location
My kitchen or my listening room.
Well, both good time (and phase) alignment and amplitude alignment between channels is the bigger problem, but indeed, removing non-delay parts of the midrange (and everything else) is a good place to start.

Remember that a phase shift that looks like phase=2*pi*f*t (where t is the time delay in seconds, f the frequency in Hz, and phase being the phase shift in radians) is exactly a time delay. Time delay and phase shift are inextricably linked. In fact, if you want to know the time delay of a process, you can do a linear fit on the unwrapped phase of the process, and there's your average delay. The slope at any given point provides the time delay at that given point, too (but it's a touch more complicated than just that).
 

ernestcarl

Major Contributor
Joined
Sep 4, 2019
Messages
3,110
Likes
2,327
Location
Canada
rew seem not have cumulative spectral decay.

Well, there is... but how to set it up is not particularly straightforward it seems. You have to make adjustments to your filtering analysis and other view settings to get better insight with the plots. Application of some extra IR windowing/gating is also not straightforward as well as it seems one may need to export a filtered/windowed IR first then re-import it back into REW -- not sure if that is even necessary. I think CSD plots are really hard to compare between different sources because your own measurement parameters (how accurate are your measurements anyway?) as well as filtering view settings can be manipulated in so many ways.

1613611796113.png
 

bennybbbx

Addicted to Fun and Learning
Joined
May 27, 2020
Messages
691
Likes
124
Location
germany
Well, there is... but how to set it up is not particularly straightforward it seems. You have to make adjustments to your filtering analysis and other view settings to get better insight with the plots. Application of some extra IR windowing/gating is also not straightforward as well as it seems one may need to export a filtered/windowed IR first then re-import it back into REW -- not sure if that is even necessary. I think CSD plots are really hard to compare between different sources because your own measurement parameters (how accurate are your measurements anyway?) as well as filtering view settings can be manipulated in so many ways.

View attachment 113236

I think you can get db values to set the cursor when you click on a frequency. in my screenshot i do this at 995 hz. the level is 88.7 db and 40 ms later it is 85.3 db. this is only 3 db after 40 ms. that look as nonsense. i also do measure with lower volume, the result was after 40 ms less db. so i thougt make loud can see more diffrence.

can you please upload your mdat file, so i can see what parameter you use ?. In your plot reach 60 db before 14.9 ms. this look more usefull. to compare csd then need a set of default setttings or need on all csd plots add the settings that is use
 

ernestcarl

Major Contributor
Joined
Sep 4, 2019
Messages
3,110
Likes
2,327
Location
Canada
In your plot reach 60 db before 14.9 ms. this look more usefull. to compare csd then need a set of default setttings or need on all csd plots add the settings that is use

The cursor was pointed at the lower left corner so I would have ignored the dB level in green. Also REW may not be the best way to view CSD type of plots.

1613652440558.png


The measurement (10dB offset) was taken in not so ideal circumstances with the front port blocked and some EQ applied. Quite frankly, I do not think it is going to be of much use.
 

ctrl

Major Contributor
Forum Donor
Joined
Jan 24, 2020
Messages
1,629
Likes
6,214
Location
.de, DE, DEU
Also REW may not be the best way to view CSD type of plots.
Yes, evaluating and assessing CSD is not easy. But, of course, it is easier than evaluating the decay behavior of a driver by looking at the step response.

The most important thing is the suppression of room resonances/reflections, because of course you don't want to evaluate the decay of the listening room. This only works via a gated window.
To be sure that the considered resonances in the CSD are really no room resonances, it helps if not only the possibility of a time-based representation is available, but also a oscillation period-based representation.

An example:
Midrange measured at 1m from cabinet without crossover.
1. CSD based on "optimal"** gated measurement
2. CSD based on bad gated measurement, a small part of a room resonance is included in the waterfall diagram.
3. same as 2 but as spectrogram
4. same as 2 but a CSD based on oscillation period in spectrogram representation
1613659426752.png 1613659448256.png 1613659681291.png 1613659695568.png
In the period-based representation 4, the spatial reflection can be identified as an angular decay process.
If you want to read more about this: I. Mateljan, H. Weber, A. Doric: Detection of Audible Resonances

In addition, the CSD is also strongly dependent on the sampling frequency of the measurement.

The whole thing is that simple ;)

** as good as it gets
 
Last edited:

ernestcarl

Major Contributor
Joined
Sep 4, 2019
Messages
3,110
Likes
2,327
Location
Canada
it helps if not only the possibility of a time-based representation is available, but also a oscillation period-based representation.

I think that’s what I thought as well with wavelet spectrogram view being somewhat easier to “read” and more useful (to me at least) in REW. But I’d rather leave the detailed loudspeaker analysis to others.
 

bennybbbx

Addicted to Fun and Learning
Joined
May 27, 2020
Messages
691
Likes
124
Location
germany
I have now find settings that show clear which is precise and which is not. i have add headphones too. because lp6 have crossover 1.5 khz i choose frequency 1 khz for all speakers to compare. the waterfal image is not very usefull. in decay i choose 1 ms slice interval and so the db values are display for 1 khz. so can clear see how much. I try lower values as 1 ms slice intervall but thats not possible. the kali have low volume. so you need always subtract the other values from the 1. value. soothing 1/3 i use because with smoothing 1/48 the frequency response change much and can not good compare. The eris 3.5 look best in this and i think they sound a little more clear as the mtm but i like the mtm more i think rooms sound more real. so i keep the eris 3.5 and the MTM and the canton 4 inch i sold. the canton sound clear not so good as the MTM and Eris 3.5 in stereo width.
iloud mtm.jpg
Kali LP6.jpg
Presonus eris 3.5.jpg
AKG K1000 headphone.jpg
Panasonic RP TH030 Headphone.jpg
Celestion Guitar box 10 inch greenbag.jpg
canton kali as sub.jpg
 
Last edited:

tuga

Major Contributor
Joined
Feb 5, 2020
Messages
3,984
Likes
4,285
Location
Oxford, England
The cursor was pointed at the lower left corner so I would have ignored the dB level in green. Also REW may not be the best way to view CSD type of plots.

View attachment 113322

The measurement (10dB offset) was taken in not so ideal circumstances with the front port blocked and some EQ applied. Quite frankly, I do not think it is going to be of much use.

Could it be that @John Atkinson applies (1/6 octave?) smoothing to his CSD plots?
 

bennybbbx

Addicted to Fun and Learning
Joined
May 27, 2020
Messages
691
Likes
124
Location
germany
I think that’s what I thought as well with wavelet spectrogram view being somewhat easier to “read” and more useful (to me at least) in REW. But I’d rather leave the detailed loudspeaker analysis to others.

I think most important value is to use small rise time. they use 0,15 ms. your used risetime of 6 ms is much too slow to show speaker precision https://www.stereophile.com/content/kef-ls50-meta-loudspeaker-measurements

here you can see a slow 10 inch speaker and a fast electrostatic speaker in compare. I think that the magnepan speaker sound more stereo happen mostly because they are fast in the mid range ears need for binaural hearing. http://theaudioannex.com/forum/threads/how-to-read-a-speakers-cumulative-spectral-decay-plot.9439/

maybe you can measure your speakers with the settings they use ?. 0,1 ms rise time 4 ms time range and if you have good signal to noise ratio you need no CSD mode and so to reduce room influence you can set window size to 4 ms too.

and in REW manual stand this about CSD mode. i better not use it and use shorter window time. the curve on low frequency is because window time is too short for CSD mode.

In addition to the standard waterfall mode, which slides the window along the impulse response, there is a CSD (Cumulative Spectral Decay) mode, which anchors the right hand end of the window at a fixed point and only moves the left side, which may be useful when examining cabinet or tweeter resonances over very short time spans if the IR data descends into the noise floor soon after the region being examined. Using CSD mode in those cases prevents the later slices from including increasing amounts of noise floor. This does mean, however, that the frequency resolution reduces (and the lowest frequency that can be generated increases) as the slices progress, as each has a slightly shorter total window width than the previous slice. Note also that it does not make sense to have a time range greater than the window width in CSD mode as the window, with its fixed right hand edge, reaches zero width after stepping along by a time interval equal to the window width and there will be no data for subsequent slices. In CSD mode window width should be greater than the time range. CSD mode is often not required for measurements that have good signal to noise ratio, not using it allows frequency resolution to be maintained throughout the time range of interest.
 
Last edited:

ernestcarl

Major Contributor
Joined
Sep 4, 2019
Messages
3,110
Likes
2,327
Location
Canada
Could it be that @John Atkinson applies (1/6 octave?) smoothing to his CSD plots?

Don't really know.

From Stereophile
1614042993901.png

30dB scale? Measurements: Fig. 2 Tannoy Revolution XT 6, cumulative spectral-decay plot calculated from output of accelerometer fastened to center of sidewall

JA's technique is quite different in that he uses an accelorometer.

(edit: forgot Amir had a Klippel CSD for the same coax speaker)
1614072917309.png


CLIO system from acoustic measurements look a little different (speaker uknown):
1614043655899.png

40dB scale. Rise time 0.58ms

Neumann shows theirs differently as well (KH120)
1614043465561.png

30 dB scale. No rise time specified and resolution probably is lower

Resolution Magazine do show CSD type looking waterfalls in their measurements
1614043604365.png

40dB scale. Presonus Sceptre S8

I could not quite see the ~550Hz resonance in my own earlier very nearfield measurements... but there was some around 470Hz or so instead, if I remember correctly.

I haven't really thought of it much as something to show speaker "precision", speed, or stereo accuracy as @bennybbbx. As a way to check for extended resonances or ringing, sure.
 
Last edited:

ernestcarl

Major Contributor
Joined
Sep 4, 2019
Messages
3,110
Likes
2,327
Location
Canada
I think most important value is to use small rise time. they use 0,15 ms. your used risetime of 6 ms is much too slow to show speaker precision https://www.stereophile.com/content/kef-ls50-meta-loudspeaker-measurements

here you can see a slow 10 inch speaker and a fast electrostatic speaker in compare. I think that the magnepan speaker sound more stereo happen mostly because they are fast in the mid range ears need for binaural hearing. http://theaudioannex.com/forum/threads/how-to-read-a-speakers-cumulative-spectral-decay-plot.9439/

maybe you can measure your speakers with the settings they use ?. 0,1 ms rise time 4 ms time range and if you have good signal to noise ratio you need no CSD mode and so to reduce room influence you can set window size to 4 ms too.

and in REW manual stand this about CSD mode. i better not use it and use shorter window time. the curve on low frequency is because window time is too short for CSD mode.

With the same mdat file measurement... It seems that 500+Hz resonance of the S8 can be seen clearer with those settings:

1614046139806.png


Though I'm not really sure that I should care much more about it than merely acknowledging that it is visible there in this view when zoomed-in really close.
 

tuga

Major Contributor
Joined
Feb 5, 2020
Messages
3,984
Likes
4,285
Location
Oxford, England
From Stereophile
index.php

30dB scale? Measurements: Fig. 2 Tannoy Revolution XT 6, cumulative spectral-decay plot calculated from output of accelerometer fastened to center of sidewall

JA's technique is quite different in that he uses an accelorometer.

He also uses a microphone for the speaker output CSD:

1220KEF50fig10-2.jpg

Fig.10 KEF LS50 Meta, cumulative spectral-decay plot on HF axis at 50" (0.15ms risetime).


819Klipfig09.jpg

Fig.9 Klipsch Klipschorn, cumulative spectral-decay plot on tweeter axis at 50" (0.15ms risetime).


Measuring Loudspeakers, Part Two Page 6

To produce a meaningful CSD, the time data need to be free both from noise—it helps to average as many separate impulse response measurements as the host PC can manage—and from environmental reflections, such as those from the microphone stand and its associated hardware, and the speaker support. If not, such reflections produce spurious ridges in the plot that might be interpreted as indicating the presence of resonances. Again, it is also important not to aggressively window the data and produce too short a time record. While this can produce smooth-looking plots [37], they are misleading. Version 10.0A of the MLSSA software flags the area in a CSD plot with dots where the data are invalid due to an inadequate time record (shown in the bottom-left corners of figs.18 & 19). Hawksford [38] has also suggested modifying the CSD plot by compensating for the loudspeaker's minimum-phase behavior. This should make lower-frequency resonances easier to see, but I have yet to try it.

https://www.stereophile.com/content/measuring-loudspeakers-part-two-page-6
 
Top Bottom