
-
WANTED: Happy members who like to discuss audio and other topics related to our interest. Desire to learn and share knowledge of science required. There are many reviews of audio hardware and expert members to help answer your questions. Click here to have your audio equipment measured for free!
You are using an out of date browser. It may not display this or other websites correctly.
You should upgrade or use an alternative browser.
You should upgrade or use an alternative browser.
Speaker Equivalent SINAD Discussion
- Thread starter MZKM
- Start date
DDF
Addicted to Fun and Learning
- Joined
- Dec 31, 2018
- Messages
- 617
- Likes
- 1,360
Not a thin one. Recommendation is to get a shaggy carpet with thick breathable underlayment. Mine is probably 3 inches thick which is quite broadband without it being a trip hazard.
My house came with a shag rake, I feel for you.
")
That thickness helps but
1. that thickness is quite uncommon. More typical absorption coefficients (125, 250, 500, 1000, 2000, 4000 Hz):
(@ floor bounce angle is probably less). Taken from:
http://www.acoustic.ua/st/web_absorption_data_eng.pdf
2. There's your own argument refuting the effectiveness of even such an outrageously thick thing...
https://www.audiosciencereview.com/...cts-of-room-reflections.13/page-6#post-292807
Last edited:
AnalogSteph
Major Contributor
That must be a nightmare to keep clean.
xr100
Addicted to Fun and Learning
Hmm... a choice between dust mite heaven (yikes!) and audio...
It is a throw-rug. It is called "modern shag" and it is indeed that. Nothing like the old shag carpets of 60s and 70s. Here is a shot of it:
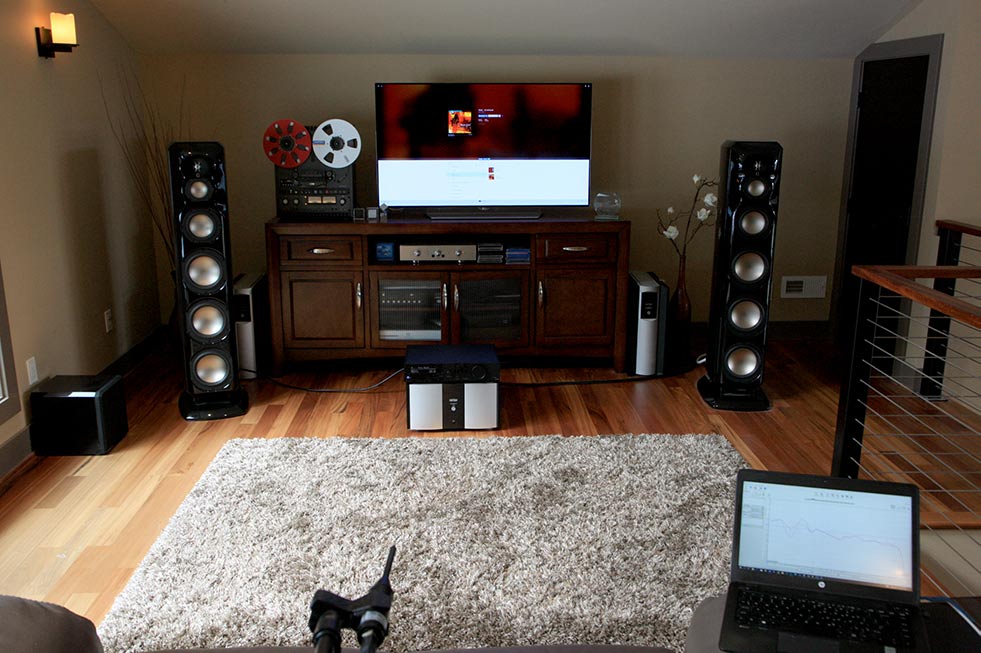
First person who says it is not 3 inches will get a two week ban! Fish stories are not just for fishing....
First person who says it is not 3 inches will get a two week ban! Fish stories are not just for fishing....
Hmm... a choice between dust mite heaven (yikes!) and audio...
FWIW: https://www.rugknots.com/blogs/professional-cleaners/5-ways-to-keep-your-shag-rugs-looking-new
#8 looks good.
- Joined
- Feb 23, 2016
- Messages
- 20,754
- Likes
- 37,593
I think I commented previously on this picture that you had a nice retro rug. Questioning if it came out a previous camper van. It does look different than the real retro shag though. As shown here. Anyway, looks like it is 8ft by 8 ft.It is a throw-rug. It is called "modern shag" and it is indeed that. Nothing like the old shag carpets of 60s and 70s. Here is a shot of it:
First person who says it is not 3 inches will get a two week ban! Fish stories are not just for fishing....
Last edited:
First person who says it is not 3 inches will get a two week ban! Fish stories are not just for fishing....
My wife always asks, "Is that real inches or ***** inches?"
It is a throw-rug. It is called "modern shag" and it is indeed that. Nothing like the old shag carpets of 60s and 70s. Here is a shot of it:
First person who says it is not 3 inches will get a two week ban! Fish stories are not just for fishing....
I will not say it's not 3 inches as I was already banned for 2 weeks so I will just post a photo of an object of similar size:
I also can't resist to add that measurement shown on the notebook doesn't look very promising..
My wife always asks, "Is that real inches or ***** inches?"
You can always find comfort/solution in a way shown in my previous post.
- Joined
- Feb 23, 2016
- Messages
- 20,754
- Likes
- 37,593
Here in the USA, I always went with the metric system.
Here in the USA, I always went with the metric system.
How dare you say that now when Kingdom is in great troubles?! Have you not fear of Thomas?
- Joined
- Feb 23, 2016
- Messages
- 20,754
- Likes
- 37,593
Well if we are discussing ale I'd be using pints of course.How dare you say that now when Kingdom is in great troubles?! Have you not fear of Thomas?
Nooooo. There is no single aspect to be equivalent to sinad. If there is it is frequency response. But the room is way more important than the speakers. ALL specs will be important in speakers.
Nooooo. There is no single aspect to be equivalent to sinad. If there is it is frequency response. But the room is way more important than the speakers. ALL specs will be important in speakers.
You’re right, Sean Olive’s predicted preference rating for speakers is not equivalent to SINAD for DACs/amps – it’s better. It has been proven to strongly correlate with actual preference ratings listeners gave to a large number of speakers of multiple types, sizes and brands in controlled double-blind listening tests. I’m not aware of a study that has done the same for SINAD with this kind of scientific rigour.
Also, as can be seen if you read the AES paper in which Olive first proposed this preference rating (which I previously linked to in this thread), all four of the variables that make up the preference rating algorithm are statistical metrics indeed based on the speaker’s measured frequency response curves, namely the on-axis response, early reflections, sound power, predicted in-room response (a weighted average of the previous three curves), and listening window. Multiple studies by Floyd Toole and Klippel have shown that nonlinear distortion e.g. THD has little effect on perceived sound quality of speakers in blind listening – nearly all subjective judgements of speaker sound quality come down to aspects of frequency response, so it’s not correct that all speaker specs are equally important.
Of course, room acoustics play a big part in perceived speaker sound quality, but a speaker should be judged as it would perform in an average listening room, which the listening tests done by Olive were close to (0.3-second reverberation time compared to 0.4 seconds for an average of over 600 real domestic rooms measured). The correlation of Olive’s predicted preference ratings to actual reported preference ratings of 0.86 is frankly astonishing, and without doubt the best metric we currently have to judge speaker sound quality, that is based on decades of real science and research in the field.
It is a throw-rug. It is called "modern shag" and it is indeed that. Nothing like the old shag carpets of 60s and 70s. Here is a shot of it:
First person who says it is not 3 inches will get a two week ban! Fish stories are not just for fishing....
Maybe we should start a new thread entitled “How Thick is a Shagpile Rug?’ for people who want to discuss this further. Or we can merge it with the very technical discussion in the ‘How long is a Piece of String’ thread
Anyway, back to speaker rankings. As you mentioned you will be measuring subwoofers, I was also thinking about how you could give a predicted preference rating for them as well. I think the inverse process to that I proposed for the maximum potential speaker rating could be done, giving a potential rating for the sub in a best-case scenario when used with ideal speakers. This can be calculated by using the ideal values of NBD_ON = NBD_PIR = 0 and SM_PIR = 1 in Olive’s formula, and plugging in the actual LFX value of the particular subwoofer in question. However, this is defined as the frequency at “-6 dB relative to the mean level y_LW measured in the listening window (LW) between 300 Hz-10 kHz.” Obviously, this frequency range is outside that of a subwoofer, so I would change the range to 60 Hz-80 Hz, which will be within the peak, flat response region of the vast majority of subwoofers.
As this only uses a single variable (LFX) of the subwoofer though, I suggest an alternative rating, that also takes into account the Low Frequency Quality (LFQ) variable Olive used in his first preference rating formula for the 13 speakers in the initial listening test. He states:
However, as this was originally defined for use with speakers, and we’re only characterizing a subwoofer here that is not meant to reach flat up to 300 Hz, I suggest a lower upper-bound of 120 Hz be chosen in the LFQ formula, which would just overlap nicely with the lower-bound of 100 Hz in the narrow-band deviation and smoothness variables used for the speaker ratings (all this in addition to using 60-80 Hz as the frequency range for the mean amplitude in the listening window, y_LW, as was done for subwoofer LFX). 120 Hz is also commonly the highest crossover frequency that can be set on a subwoofer, the limit where bass localization can become an issue, and the maximum frequency sent via the ‘.1’ LFE (low-frequency effects) channel in movies, TV series and games, which would be very important to home theatre users / gamers (a huge market for subwoofers), not to mention multichannel audio (music) listeners.LFQ is intended to quantify deviations in amplitude response over the bass region between the low frequency cut-off and 300 Hz.
The question then is, what weightings should these two variables, LFX and LFQ, have in a subwoofer rating formula? I would suggest keeping the relative weightings from Olive's first preference rating formula (equation 9 in his paper) i.e. coefficients of -1.28 for LFX and -0.66 for LFQ. Olive states these correspond to a 'proportional contribution to the model' of 6.27% and 18.64% respectively. (This may seem at odds with their coefficients, but calculating percentage contribution of variables in a multiple linear regression model is apparently not straightforward, so let's take his word for these numbers.) So LFQ has approximately a three times greater contribution in predicting preference than LFX. This may seem imbalanced, but consider that LFQ, by the definition given in equation 8, is mathematically quite dependent on LFX (whereas the inverse seems less so).
This can be seen by considering that, all other metrics being equal, a sub with extension down to 15 Hz (low LFX) is mathematically likely to have a lower LFQ value (less mean deviation from the average listening window amplitude) than a sub that only extends to 30 Hz, merely due to having a greater proportion of its frequency response from its -6 dB point to 120 Hz (upper bound of the LFQ variable) closer to the listening window average. This is due to the bass roll-off being counted by the LFQ formula as deviation from the average listening window amplitude. So LFQ is effectively ‘weighted’ by LFX, meaning in practice the contribution low-frequency extension and bass amplitude deviation have to predicting preference is likely more equally weighted in this model than Olive’s stated percentages for LFX and LFQ contribution suggest. (The partial dependency of LFQ on LFX, or their ‘collinearity’, is evidenced by their close proximity in the ‘correlation circle’ in Figure 3 of Olive’s paper, in which variables that are closer are more strongly correlated with each other.)
We can now calculate the 'y-intercept' of the formula, by using the ideal scenario in which the -6 dB point is 14.5 Hz (as previously calculated from setting Olive's preference rating to a perfect 10 in his formula), and so LFX = log10(14.5) = 1.16, and LFQ = 0 i.e. no deviations from the 60-80 Hz listening window average between the -6 dB point and 120 Hz. (Obviously, the latter is not 100% physically possible as the bass-roll off cannot be infinitely steep, but this is an ideal case after all.) Plugging these numbers into our formula for the case of a maximum 10 score, we get a y-intercept of 11.49.
So finally, we arrive at a formula for subwoofer ratings using both LFX and LFQ variables of:
11.49 – 1.28*LFX(sub) – 0.66*LFQ(sub)
Where LFX(sub) is the log10 of the first frequency x_SP below 60 Hz in the sound power curve that is -6 dB relative to the mean level y_LW(sub) measured in the listening window LW(sub) between 60 Hz and 80 Hz, and LFQ(sub) is the level within each n band of the sound power curve calculated across N bands, from the lowest frequency defined by LFX(sub) up to 120 Hz.
I think this would be a good rating formula to use and present for each subwoofer measured, as it takes into account both low frequency extension and quality (deviation from flat). However, I also think you should post the -6 dB lower frequency point, and the individual calculated values for the LFX(sub) and LFQ(sub) variables for all subs, as well as the four variables in Olive's speaker formula (NBD_ON, NBD_PIR, SM_PIR and LFX) for all speakers measured, for two reasons. First, posting the values for all variables would give a nice comparative breakdown of a subwoofer or speaker’s performance, so individual areas of their performance can be compared between different speakers / subs, in addition to a total score. Second, having the values of all variables for everyone to see and use would allow them to create formulas for their specific set-up, for example, the ‘maximum potential rating’ for subwoofers used with ideal speakers as I explained in the beginning of this post, or combining any one of the ratings of the speakers you have measured with one of the sub’s ratings, by replacing the LFX value of the speaker in Olive’s rating formula with the LFX(sub) value of the subwoofer. You could add all these variable values to the end of each review, in the form of a table or Excel spreadsheet file for example.
Last edited:
OP
- Thread Starter
- #117
I don’t think you can apply the same formula. Any small deviations in FR would be inconsequential to room modes.Maybe we should start a new thread entitled “How Thick is a Shagpile Rug?’ for people who want to discuss this further. Or we can merge it with the very technical discussion in the ‘How long is a Piece of String’ thread
Anyway, back to speaker rankings. As you mentioned you will be measuring subwoofers, I was also thinking about how you could give a predicted preference rating for them as well. I think the inverse process to that I proposed for the maximum potential speaker rating could be done, giving a potential rating for the sub in a best-case scenario when used with ideal speakers. This can be calculated by using the ideal values of NBD_ON = NBD_PIR = 0 and SM_PIR = 1 in Olive’s formula, and plugging in the actual LFX value of the particular subwoofer in question. However, this is defined as the frequency at “-6 dB relative to the mean level y_LW measured in the listening window (LW) between 300 Hz-10 kHz.” Obviously, this frequency range is outside that of a subwoofer, so I would change the range to 60 Hz-80 Hz, which will be within the peak, flat response region of the vast majority of subwoofers.
As this only uses a single variable (LFX) of the subwoofer though, I suggest an alternative rating, that also takes into account the Low Frequency Quality (LFQ) variable Olive used in his first preference rating formula for the 13 speakers in the initial listening test. He states:
However, as this was originally defined for use with speakers, and we’re only characterizing a subwoofer here that is not meant to reach flat up to 300 Hz, I suggest a lower upper-bound of 120 Hz be chosen in the LFQ formula, which would just overlap nicely with the lower-bound of 100 Hz in the narrow-band deviation and smoothness variables used for the speaker ratings (all this in addition to using 60-80 Hz as the frequency range for the mean amplitude in the listening window, y_LW, as was done for subwoofer LFX). 120 Hz is also commonly the highest crossover frequency that can be set on a subwoofer, the limit where bass localization can become an issue, and the maximum frequency sent via the ‘.1’ LFE (low-frequency effects) channel in movies, TV series and games, which would be very important to home theatre users / gamers (a huge market for subwoofers), not to mention multichannel audio (music) listeners.
The question then is, what weightings should these two variables, LFX and LFQ, have in a subwoofer rating formula? I would suggest keeping the relative weightings from Olive's first preference rating formula (equation 9 in his paper) i.e. coefficients of -1.28 for LFX and -0.66 for LFQ. Olive states these correspond to a 'proportional contribution to the model' of 6.27% and 18.64% respectively. (This may seem at odds with their coefficients, but calculating percentage contribution of variables in a multiple linear regression model is apparently not straightforward, so let's take his word for these numbers.) So LFQ has approximately a three times greater contribution in predicting preference than LFX. This may seem imbalanced, but consider that LFQ, by the definition given in equation 8, is mathematically quite dependent on LFX (whereas the inverse seems less so).
This can be seen by considering that, all other metrics being equal, a sub with extension down to 15 Hz (low LFX) is mathematically likely to have a lower LFQ value (less mean deviation from the average listening window amplitude) than a sub that only extends to 30 Hz, merely due to having a greater proportion of its frequency response from its -6 dB point to 120 Hz (upper bound of the LFQ variable) closer to the listening window average. This is due to the bass roll-off being counted by the LFQ formula as deviation from the average listening window amplitude. So LFQ is effectively ‘weighted’ by LFX, meaning in practice the contribution low-frequency extension and bass amplitude deviation have to predicting preference is likely more equally weighted in this model than Olive’s stated percentages for LFX and LFQ contribution suggest. (The partial dependency of LFQ on LFX, or their ‘collinearity’, is evidenced by their close proximity in the ‘correlation circle’ in Figure 3 of Olive’s paper, in which variables that are closer are more strongly correlated with each other.)
We can now calculate the 'y-intercept' of the formula, by using the ideal scenario in which the -6 dB point is 14.5 Hz (as previously calculated from setting Olive's preference rating to a perfect 10 in his formula), and so LFX = log10(14.5) = 1.16, and LFQ = 0 i.e. no deviations from the 60-80 Hz listening window average between the -6 dB point and 120 Hz. (Obviously, the latter is not 100% physically possible as the bass-roll off cannot be infinitely steep, but this is an ideal case after all.) Plugging these numbers into our formula for the case of a maximum 10 score, we get a y-intercept of 11.49.
So finally, we arrive at a formula for subwoofer ratings using both LFX and LFQ variables of:
11.49 – 1.28*LFX(sub) – 0.66*LFQ(sub)
Where LFX(sub) is the log10 of the first frequency x_SP below 60 Hz in the sound power curve, that is -6 dB relative to the mean level y_LW(sub) measured in the listening window LW(sub) between 60 Hz and 80 Hz, and LFQ(sub) is the level within each n band of the sound power curve calculated across N bands, from the lowest frequency defined by LFX(sub) up to 120 Hz.
I think this would be a good rating formula to use and present for each subwoofer measured, as it takes into account both low frequency extension and quality (deviation from flat). However, I also think you should post the -6 dB lower frequency point, and the individual calculated values for the LFX(sub) and LFQ(sub) variables for all subs, as well as the four variables in Olive's speaker formula (NBD_ON, NBD_PIR, SM_PIR and LFX) for all speakers measured, for two reasons. First, posting the values for all variables would give a nice comparative breakdown of a subwoofer or speaker’s performance, so individual areas of their performance can be compared between different speakers / subs, in addition to a total score. Second, having the values of all variables for everyone to see and use would allow them to create formulas for their specific set-up, for example, the ‘maximum potential rating’ for subwoofers used with ideal speakers as I explained in the beginning of this post, or combining any one of the ratings of the speakers you have measured with one of the sub’s ratings, by replacing the LFX value of the speaker in Olive’s rating formula with the LFX(sub) value of the subwoofer. You could add all these variable values to the end of each review, in the form of a table or Excel spreadsheet file for example.
You need to do 3 main things:
- CEA-2010
- FR before compression
- Group Delay
Measurements of Rythmik F18 (interactive graphs are a plus; you can also sort all subwoofers measured by max SPL at a chosen frequency, as movie watches want max SPL at 20Hz or lower, whereas many music-only listeners usually only care about 35Hz-40Hz)
Measuring all the adjustments like Data-bass does would be a cherry on top, but not absolutely necessary.
Last edited:
So here is where we are:
1. I can stop doing any reviews for a week while I build the tool to generate the preference ratings.
2. We get a volunteer to do that and I provide the data from Klippel.
Which way should we go?
1. I can stop doing any reviews for a week while I build the tool to generate the preference ratings.
2. We get a volunteer to do that and I provide the data from Klippel.
Which way should we go?
OP
- Thread Starter
- #119
You can probably crowd source #2.So here is where we are:
1. I can stop doing any reviews for a week while I build the tool to generate the preference ratings.
2. We get a volunteer to do that and I provide the data from Klippel.
Which way should we go?
I'm working with the txt file you shared, after ~20min in Excel I have all the 14 bands, the avg band SPL, the abs difference of each 10 measurements per band, I just am figuring out the summation bit.
Figured it out, you sum the average deviation per band, not sum all 10 deviations per band.
Last edited:
OP
- Thread Starter
- #120
So, @amirm
I got NBD_ON calculated
NBD_PIR should now be easily obtained. done
LFX should already have been easy to obtain. done
SM_PIR is the only one that seemingly is a challenge.
I believe I have this done, but am not entirely sure, as when I use the predicted SPL, it varies from the regression by more than I would like.done (I think).
For the spreadsheet savvy, right now the LFX formula gives the row # in Column A, and then I have to index it to get the value of cell A#, but I have to manually type the #, does anyone know how to automate this?
Figured it out.
I got NBD_ON calculated
I believe I have this done, but am not entirely sure, as when I use the predicted SPL, it varies from the regression by more than I would like.
Figured it out.
Last edited:
Similar threads
- Replies
- 331
- Views
- 45K
- Replies
- 11
- Views
- 1K
- Replies
- 226
- Views
- 33K
- Replies
- 1
- Views
- 236