NorthGraves
Member
- Joined
- Nov 29, 2019
- Messages
- 86
- Likes
- 43
DPLL Bandwidth setting - anyone tried?
I just read this:
https://www.diyaudio.com/forums/digital-line-level/314935-es9038q2m-board-584.html
"Regarding DPLL, try setting it as low as you can before the dac playback becomes unstable (depends on incoming jitter level).
You may be able to set it lower with USB than with TOSLINK.
People tend to report that lowering the DPLL setting improves sound quality quite a bit."
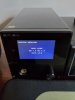
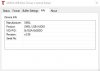
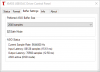
Then changed the DPLL Bandwidth from Default (7) to MIN (1) - so far so good, no issues.
I just read this:
https://www.diyaudio.com/forums/digital-line-level/314935-es9038q2m-board-584.html
"Regarding DPLL, try setting it as low as you can before the dac playback becomes unstable (depends on incoming jitter level).
You may be able to set it lower with USB than with TOSLINK.
People tend to report that lowering the DPLL setting improves sound quality quite a bit."
Then changed the DPLL Bandwidth from Default (7) to MIN (1) - so far so good, no issues.
") Fidelity otherwise was excellent though. To wit, I am still listening to the M500 using the HD-650 as I type this. Typically a good sign that I like what I am hearing."
Fidelity otherwise was excellent though. To wit, I am still listening to the M500 using the HD-650 as I type this. Typically a good sign that I like what I am hearing."