• WANTED: Happy members who like to discuss audio and other topics related to our interest. Desire to learn and share knowledge of science required. There are many reviews of audio hardware and expert members to help answer your questions. Click here to have your audio equipment measured for free!

Share your in-room measurements?

thorvat

Senior Member
Joined
Aug 9, 2021
Messages
323
Likes
386
Since my last measurements, I have changed my preamp and altered the gain structure setup for my equalizer. And I am trying to do things a bit more carefully.

Here's the setup: Dayton Audio calibration mic into Presonus Studio 24c (both mic and interface have been calibrated, the latter with a loopback test) into a line input on my B&K MC-101 Sonata preamp. On the preamp, the line amp is engaged, the tone controls are defeated, and the EQ loop is engaged. The PEQ is a Yamaha YDP2006 digital parametric equalizer from a couple of decades ago. The Yamaha equalizer provides six parametric filters for each channel, with +/- 12 dB of gain, and a Q range of 1-10, plus low and high shelf filters. Each channel also includes six notch filters, of which two can be reconfigured as low and high-pass filters. It also include pre-emphasis to hot-rod the high frequencies going into the processor, which I have turned off. The DSP portion includes an internal in-and-out converters comprising 20-bit Burr-Brown PCM1760P ADC and a PCM63P DAC clocked at 44.1 KHz. Analog gain amps are provided by common 5532 op-amps. This equalizer has good specs for its day--distortion better than -80 dB, noise likewise, and a dynamic range of 106 dB. In a playback chain, this isn't terrible, though the specs won't look as good as one of the better miniDSP models, and I have sort-of poked around what those units would require (in dollars) to make a real improvement.

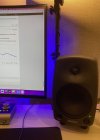
The output of the B&K preamp is fed to a pair of B&K Reference 125.2 amplifiers driving Revel Concerta F12 speakers in a biwire arrangement that does nothing but let me use both of the amps I own. (The amps will be replaced with an incoming Buckeye NC502MP amp in the search for more power and also just because.

Obviously, REW isn't going to attempt to support that Yamaha commercial PEQ directly. I do wish that they would provide a configurable equalizer, rather than a (long) list of more current models. Being able to program the number and type of filters would at least minimize the back-and-forth required to get REW not to suggest more filters than I have.

So, to the measurements. I have used the "psychoacoustic" smoothing, because my purpose isn't looking at comb filtering but rather identifying what PEQ filters I need. And with 1/12 smoothing, the EQ algorithm in REW asked for many more filters than the Yamaha provides.

Before:

1121Rev2_BeforeEQ.jpg


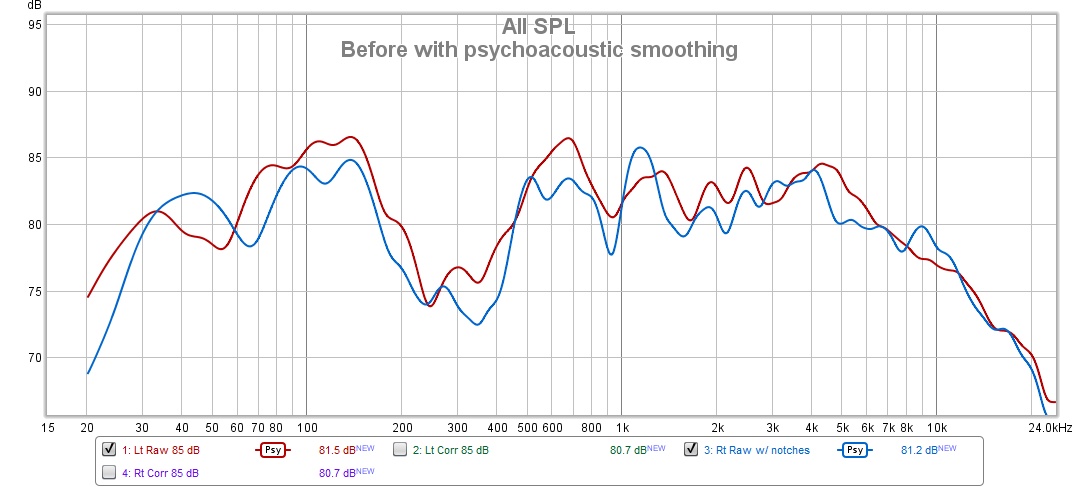
I used the equalizer feature to attempt to match a target with a low-frequency cutoff of 25 Hz and a 0.6 dB/octave downward tilt from there up. REW distinguishes the bass range from everything else, so I had to define around the 200-Hz boundary it defines. I have to say that my room is not very intense on first reflections, so I'm not thinking the stronger downward tilt of the Harman model would be exactly right in this room. So I've gone a bit flatter, which fits my preference in any case.

I gave REW the range of up to 1000 Hz, recognizing that the changes I wanted to see at 900 Hz were probably not minimum phase.

The big hole at 200-400 Hz troubles me. It's well below the crossover between the woofers and mid-range driver, which is at 575 Hz, so I don't think it's a suckout. I see big spikes in excess group delay at 240, 325, 353, and 425 Hz, but I'm still trying to sort out in my head what all that actually means. I think it means not trying to fix the dip in that region with narrow filters. But there's something happening in the room to cause that issue--the anechoic response of these speakers doesn't show it.

Here are the PEQ corrections I made:

PEQ-1121-Rt.JPEG


PEQ-1121-Lt.JPEG


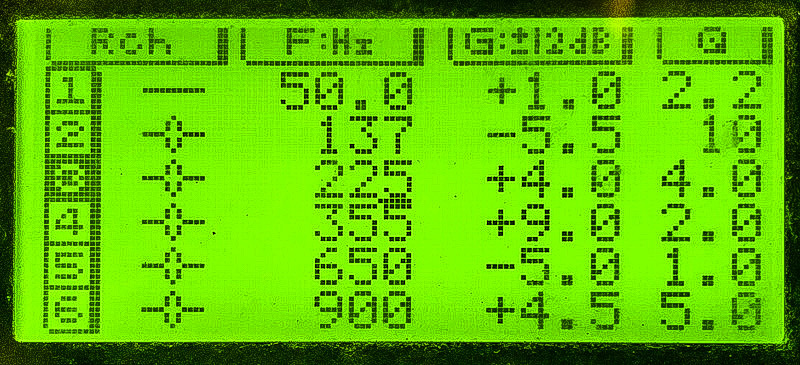
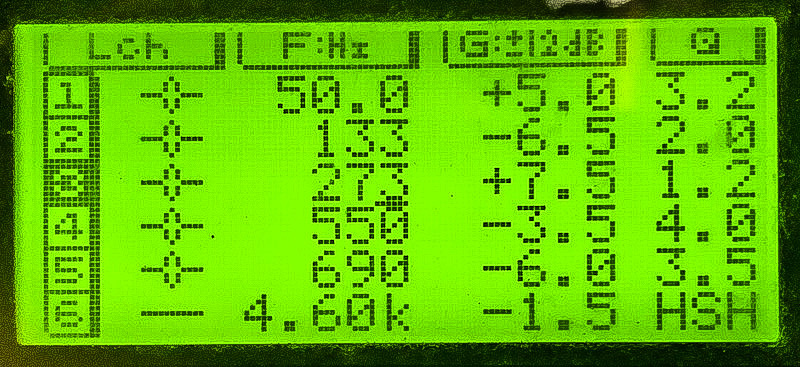
Note that Filter 1 on the right channel is switched out, as is Filter 6 on the left channel. The Q range goes to 10, but I have no idea what the numbers mean, or how they compared to the Q values used in REW for the "Generic" equalizer. I kept the numbers fairly low to keep the filter shapes broad, in the (ignorant) hope that it will work around those frequencies that see excess group delay.

Filling that gap requires a LOT of gain in the equalizer. I cannot for a moment consider dropping everything else in the band. But I did substantially attenuate the signal so that with the equalizer looped in by the preamp. the overall loudness noticeably decreases. I should measure some levels with my SSVM to determine where I can set those values to avoid clipping the return input of the preamp (which is upstream of the line stage). I did notice more distortion in the REW plot than I have seen before, with lots of regions above 1% coming out of the speakers. I can't hear a problem, but that doesn't mean it isn't there. So, there's more to do. I'm not worried about starving the amp--I'm already at full input capability of the amp halfway up the volume pot of the preamp.

Here's the response with the EQ corrections:

1121Rev2_AfterEQ.jpg


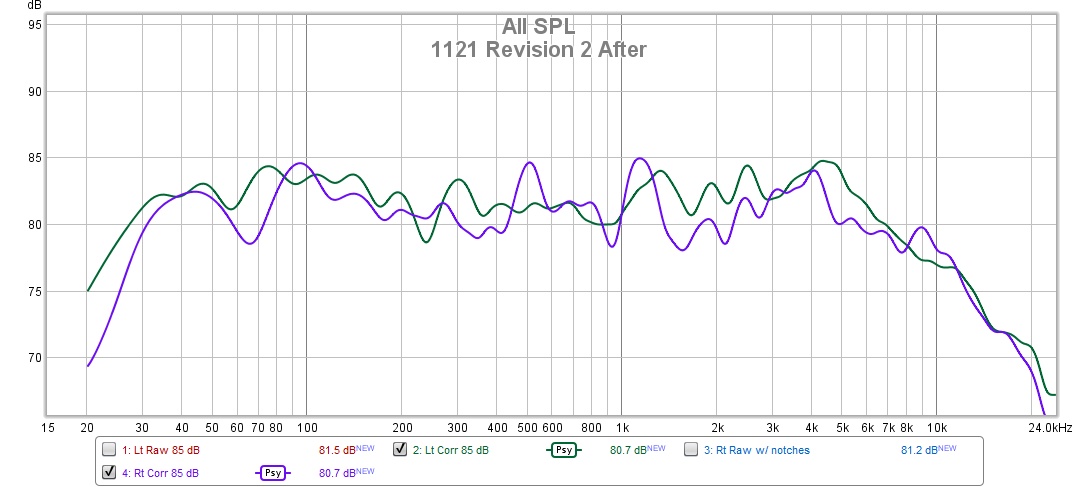
I cannot explain the rolloff in the top octave. I always see it, but it's not the microphone, which was provided with a calibration file that shows little correction up there. I know the speakers are capable up to 20 KHz, but I don't know what in my room might be sucking them up. That's on the list to fully understand. Not that I can hear much up there.

And there's a bump at 3-4 KHz that I did not mess with--a trim at that point should make the whole graph acquire that obvious downward spectral tilt. I still have an open filter on each channel if I decide I can mess with it.

Rick "still on the steep part of the learning curve, it seems" Denney

Your filters are looking good, but I would suggest you skip the 900Hz filter on the right channel and 4.6kHz filter on the left channel as this is above room influence range so not covered accurateky by your emasurement.
 

czt

Active Member
Joined
Jul 14, 2021
Messages
142
Likes
90
USB microphones officially not supported with Sonarworks, but in my case Reference 4.4.7 (Build 38) working with UMIK-1 through ASIO4ALL.
It even measured the speaker and listening spot distances with exact precision.
Képernyőkép 2022-01-01 155432.png
Képernyőkép 2022-01-01 155517.png
 

iulianm

Member
Joined
Jan 1, 2022
Messages
75
Likes
98
Location
Greater Seattle Area
Could be, measurements do differ with speaker placement and the measurements posted above are after fiddling 15-20 times with placement.
I just ordered UMIK-1calibrated mic and will redo measurements next week after it arrives.
 
Last edited:

iulianm

Member
Joined
Jan 1, 2022
Messages
75
Likes
98
Location
Greater Seattle Area
I've got the UMIK-1 today and I've done measurements for all three systems at my listening position:
  • B&W 603 S2 Anniversary Edition + SVS SB-1000
  • ELAC UB5 + AudioEngine S8
  • AudioEngine A5+ (desktop)

bw.png
elac.png
AE.png
 

MakeMineVinyl

Major Contributor
Joined
Jun 5, 2020
Messages
3,558
Likes
5,873
Location
Santa Fe, NM
Looks like you have some consistent room disturbances between 100 - 200Hz.
 

iulianm

Member
Joined
Jan 1, 2022
Messages
75
Likes
98
Location
Greater Seattle Area
Yeah, I have no room treatment.
I played today some more and I believe AudioEngine S8 subwoofer sucks; I got it before I was that interested into audio (4-5y ago) and the issue I had with since I've got it was that I can localize it even if I go with the crossover around ~60Hz.

I've placed today the SVS SB-1000 in the place of AudioEngine S8 at my home cinema and this is the response on 20-80Hz range (I have crossover at 80Hz).

SVS is 12" and S8 is just 8" however SVS is small enough and just $100-150 more (which seems like peanuts in audiophile world). I believe also SVS is much more transparent and it just seems that the speakers have more bass.

On the specs, the AudioEngine should behave better but from my measurements, it kinda falls apart from ~40-45Hz.
  • SVS SB-1000: 24Hz to 260Hz (+/- 3dB)
  • AudioEngine S8: 27 Hz-130Hz ±1.5 dB
svsvelac.png


I placed back the S8 subwoofer with AudioEngine A5 at my desktop but again I got into the issue on why I removed it in the first place: I can localize it.
On the measurements, it does indeed improve the bass/sub bass response.
ae-sub-vs-no-sub.png


This being said, I just ordered another SB-1000 ($449 now from Amazon).
 
Last edited:
Joined
May 5, 2018
Messages
88
Likes
52
Some measurements now that I have been working on my room some. 8030a + 1092a sub.
  • 7-point spatial average around my near-field listening position.
  • Var smoothing.
  • 2 ASC Tube traps in one back corner (13").
  • GIK 244s behind speakers.
  • Small room -- 11'3" x 12'4" x 8'. Rectangular with a small vestibule/entrance/angled corner.
8030 Spatial Avg.png


This is the measures response. I’ve added the passive treatment and some EQ in Roon. As far as EQ goes, I've removed that room mode at 47.6 Hz and done a little bass boost centered around 80 Hz. I don't think that is SBIR, just lack of good integration between the 1092 and 8030. I plan on upgrading to a 8341 or 8351 setup this year, but wanted to get the current setup addressed first through some room acoustical treatment.

The other option is to replace the 1092a w/one or two subs.
 
Last edited:

Thomas_A

Major Contributor
Forum Donor
Joined
Jun 20, 2019
Messages
3,458
Likes
2,446
Location
Sweden
Some measurements now that I have been working on my room some. 8030a + 1092a sub.
  • 7-point spatial average around my near-field listen position.
  • Var smoothing.
  • 2 ASC Tube traps in one back corner (13").
  • GIK 244s behind speakers.
  • Small room -- 11'3" x 12'4" x 8'. Rectangular with a small vestibule/entrance/angled corner.
View attachment 178019

As far as EQ goes, I've removed that room mode at 47.6 Hz and done a little bass boost centered around 80 Hz. I don't think that is SBIR, just lack of good integration between the 1092 and 8030. I plan on upgrading to a 8341 or 8351 setup this year, but wanted to get the current setup addressed first through some room acoustical treatment.

The other option is to replace the 1092a w/one or two subs.
Similar size/shape as my room. You should expect a peak around 45-47 Hz and a dip around 85-90 Hz
 

MCH

Major Contributor
Joined
Apr 10, 2021
Messages
2,641
Likes
2,251
Hello all, yesterday I made my first ever measurements and attempted room correction. I am a bit puzzled about the results. My question is what can I do to fine tune the eq.
So this was my first measurement without any correction. My speakers are Canton Vento 890dc (floostanders) :
1642324409758.png

So I let REW compute an eq using the "Harman’s preferred listening curve" as recommended by Julian Krause:
31.5 6
40 5.9
50 5.5
63 4.9
80 3.7
100 2.5
125 1.3
160 0.6
200 0.2
250 0
1000 -1
32000 -6
(Note that I modified the curve to match the decay of my speakers response at low frequencies. To be honest, I am not a fan of boomie music/films so I could not care less about it)
And well, this is the result:
1642324957437.png

Well the good news is that it seems to resemble the target curve, but what I was not expecting is to still see such an uneven response.
I also observe that if I superimpose the initial to the "corrected" measurements, they seem the inverse of each other, that is, where there was a valley, there is now a peak. Seems like if the eq correction was going too far. See for instance at 50 95 or ca 120 Hz:
1642325313850.png

So what can I do now? Is it possible to try to correct these new peaks and valleys somehow? To my very little understanding, it is not possible to do iterations (correct the corrected) in REW, but I might be wrong.... Anyways, comments welcome, I am very newbie but willing to learn :)
 

flipflop

Addicted to Fun and Learning
Joined
Feb 22, 2018
Messages
927
Likes
1,240
So what can I do now?
Instead of following the advice of Julian Krause, you could follow the advice of Floyd Toole: EQ down the peaks below the transition frequency and don't EQ anything above the transition frequency without guidance from comprehensive anechoic measurements.
 

MCH

Major Contributor
Joined
Apr 10, 2021
Messages
2,641
Likes
2,251
Thanks flipflop, the question for me a this point is how, not what.
 

flipflop

Addicted to Fun and Learning
Joined
Feb 22, 2018
Messages
927
Likes
1,240
Thanks flipflop, the question for me a this point is how, not what.
If you're asking how to manually make EQ filters in REW:
1) Open your measurement file (Ctrl+O)
2) Click 'EQ' in the top-center menu
3) Click the black triangle pointing downwards, in the center-left, to collapse the waterfall graph
4) Click the top-right icon with the 4 arrows (pointing up, down, left, right) and adjust the scales to your liking
5) Click 'EQ Filters' in the top-center
6) Under 'Type', change it from 'None' to 'PK'
7) Change 'Frequency' to the center frequency of a peak in your measurement
8) Adjust 'Gain' and 'Q' as needed until the peak is removed
9) Repeat step 6, 7, and 8 for all the other peaks

And if you also want to export the filters so they can be used with your EQ software:
10) In the EQ window, expand the 'Filter Tasks' menu to the right by clicking on it
11) Click 'Export filter settings as text' and save the file
12) Load the file into your EQ software of choice

It's a good idea to make a new measurement with the EQ enabled to make sure it's working as intended.
 
  • Like
Reactions: MCH

Bill Brown

Member
Joined
Sep 25, 2021
Messages
83
Likes
87
index.php


Don't be discouraged. Your results are typical and not bad. You have good potential.

I agree that you should likely discard the eq's you tried.

I like to see my target response on the graph of your response. Select the curve, then hit "EQ" on the top button.

On the right side of the new window find "target settings." My target, an approximation of the Harmon curve, is:

1642354602842.png


You may end up liking a different one, there are lots of opinions on that.

Then click "Generate measurement from target shape" and you will have the curve available on the main screen and can look at them together.

Guessing, I suspect my next move would be to put fairly narrow cuts on your peaks, like 41-ish, 61, and 78 or so. By going to the "10-200hz" view you will be able to see the frequencies clearly. These are your room modes based on the dimensions.

Also, when looking at the curves with/after eq I like to look at the graphs with different windows, going back and forth can help to understand what is going on/how aggressive to be/where the tradeoffs are. If you click on psychoacoustic smoothing you will feel a bit better :). And see below the discussion re. dips and the decreased perception of them.

After applying the notches on room modes it is nice to measure, then compare the decays on the "decay" and "waterfall" tabs. You will be impressed.

You may then need a shelving filter in the lows to get it close to the target curve, and a shelving filter in the highs to match the curve.

Don't attempt to EQ dips. If secondary to room modes it would simply increase the output from your speakers, decreasing headroom without filling them in. Narrow dips are much less perceptible. And narrow dips adjacent to narrow peaks are less perceptible as well. Don't use eq's above 300hz or so to start other than the high shelf. If the peak at 600 hz is real (need several measurements about the LP, perhaps a moving mic measurement around the LP, etc.), you would need to try and determine where it is from/how best to approach it. Many times it is acoustical treatment rather than eq.

OTOH, I did try eq on a similar anomaly in my system and listened with/without. I suspect if you hear it it will be a "boxy/hollow" coloration. This is nice to try and understand what you may hear/correlate with what you measure:

1642355259522.png


Best of luck. As I said, you have the potential for very nice sound.

Oh, and change the y-axis of your frequency response graphs to a 50db scale. Maybe 55-105db on the graphs you have. And don't be discouraged, as it will look worse.....

Bill
 
  • Like
Reactions: MCH
Joined
May 5, 2018
Messages
88
Likes
52
Here is following the setup procedures outlined by Genelec for both the 8030a and the 1092a.
8030a have -2 dB bass tilt applied and -6 dB 85 Hz bass rolloff applied.
1092a have -2 dB bass tilt applied and phase set at MLP by SPL of 85 Hz tone. 270 degree phase settings applied. Gain set at -2 dBu, which is in the -2 to +2 dBu range specified.

12 point matrix measurement around the MLP (nearfield). RMS average of both sets of measurements, Var smoothing applied.

Subjectively much better integration of sub and main speakers versus my previous posted measurement. ~47 Hz room mode seriously in play, which I can knock down with 1 PEQ in Roon.
Note the below trace is prior to applying the PEQ filter in Roon.

I think the depression I am seeing around 3kHz (which is the crossover point of the 3/4" tweeter on the 8030a) is due to my MLP ear height being a bit higher versus how these sit on my desk. I've angled them up as much as I can by tilting them back, but I believe I should raise them up about 8" or so to get them to ear height.

In the 8030c review, that dip is there too, however. Not sure how much has changed between the 'a' model and the 'c' model.
2022_01_16 8030-Matrix.png

2022_01_16 speakers too low..png
 

Attachments

  • 2022_01_16 RoonRoomMode.png
    2022_01_16 RoonRoomMode.png
    61.9 KB · Views: 78
  • GenelecOnDesk.jpeg
    GenelecOnDesk.jpeg
    222 KB · Views: 65
Last edited:

Eetu

Addicted to Fun and Learning
Forum Donor
Joined
Mar 11, 2020
Messages
763
Likes
1,180
Location
Helsinki
Here is following the setup procedures outlined by Genelec for both the 8030a and the 1092a.
8030a have -2 dB bass tilt applied and -6 dB 85 Hz bass rolloff applied.
1092a have -2 dB bass tilt applied and phase set at MLP by SPL of 85 Hz tone. 270 degree phase settings applied. Gain set at -2 dBu, which is in the -2 to +2 dBu range specified.

12 point matrix measurement around the MLP (nearfield). RMS average of both sets of measurements, Var smoothing applied.

Subjectively much better integration of sub and main speakers versus my previous posted measurement. ~47 Hz room mode seriously in play, which I can knock down with 1 PEQ in Roon.
Note the below trace is prior to applying the PEQ filter in Roon.
View attachment 179465
To me it looks very lean, the sub should be ~10dB hotter (after the 47Hz peak has been flattened). Now you have more energy in the mids than in the bass region.
 

MCH

Major Contributor
Joined
Apr 10, 2021
Messages
2,641
Likes
2,251
index.php


Don't be discouraged. Your results are typical and not bad. You have good potential.

I agree that you should likely discard the eq's you tried.

I like to see my target response on the graph of your response. Select the curve, then hit "EQ" on the top button.

On the right side of the new window find "target settings." My target, an approximation of the Harmon curve, is:

View attachment 179442

You may end up liking a different one, there are lots of opinions on that.

Then click "Generate measurement from target shape" and you will have the curve available on the main screen and can look at them together.

Guessing, I suspect my next move would be to put fairly narrow cuts on your peaks, like 41-ish, 61, and 78 or so. By going to the "10-200hz" view you will be able to see the frequencies clearly. These are your room modes based on the dimensions.

Also, when looking at the curves with/after eq I like to look at the graphs with different windows, going back and forth can help to understand what is going on/how aggressive to be/where the tradeoffs are. If you click on psychoacoustic smoothing you will feel a bit better :). And see below the discussion re. dips and the decreased perception of them.

After applying the notches on room modes it is nice to measure, then compare the decays on the "decay" and "waterfall" tabs. You will be impressed.

You may then need a shelving filter in the lows to get it close to the target curve, and a shelving filter in the highs to match the curve.

Don't attempt to EQ dips. If secondary to room modes it would simply increase the output from your speakers, decreasing headroom without filling them in. Narrow dips are much less perceptible. And narrow dips adjacent to narrow peaks are less perceptible as well. Don't use eq's above 300hz or so to start other than the high shelf. If the peak at 600 hz is real (need several measurements about the LP, perhaps a moving mic measurement around the LP, etc.), you would need to try and determine where it is from/how best to approach it. Many times it is acoustical treatment rather than eq.

OTOH, I did try eq on a similar anomaly in my system and listened with/without. I suspect if you hear it it will be a "boxy/hollow" coloration. This is nice to try and understand what you may hear/correlate with what you measure:

View attachment 179443

Best of luck. As I said, you have the potential for very nice sound.

Oh, and change the y-axis of your frequency response graphs to a 50db scale. Maybe 55-105db on the graphs you have. And don't be discouraged, as it will look worse.....

Bill
Thank you Bill for your detailed comments, this is exactly the sort of information i needed to get me started. Just started creating those peaks to try to bring down the peaks you pointed, seems very doable, lets see the results. Now i try to decipher the high/low shelves, there are too many options for those. Let's see how it works out. Cheers.
 
Top Bottom