• WANTED: Happy members who like to discuss audio and other topics related to our interest. Desire to learn and share knowledge of science required. There are many reviews of audio hardware and expert members to help answer your questions. Click here to have your audio equipment measured for free!

REW after Room Correction

OP
Kling75

Kling75

Active Member
Forum Donor
Joined
Jul 27, 2020
Messages
164
Likes
173
Location
Switzerland
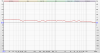
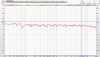
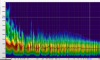
The spectrogram would also be interesting to look at. You could just post the whole .rew file and we could take a closer look at the entire information set. Also would be good to see how you have the microphone positioned when you take the measurement.
 

Attachments

  • DSC_0036.JPG
    DSC_0036.JPG
    2.1 MB · Views: 252
  • REW.png
    REW.png
    136.6 KB · Views: 259
OP
Kling75

Kling75

Active Member
Forum Donor
Joined
Jul 27, 2020
Messages
164
Likes
173
Location
Switzerland
Her you go..
 

Attachments

  • 1:6.png
    1:6.png
    153 KB · Views: 215
  • 1:24.png
    1:24.png
    169.5 KB · Views: 235
  • 45.png
    45.png
    176 KB · Views: 193
  • a.png
    a.png
    195.1 KB · Views: 179
  • var.png
    var.png
    155.8 KB · Views: 208
  • DSC_0032.JPG
    DSC_0032.JPG
    1.8 MB · Views: 221
  • DSC_0036.JPG
    DSC_0036.JPG
    2.1 MB · Views: 194
  • var.png
    var.png
    155.8 KB · Views: 203
  • Psy.png
    Psy.png
    161.4 KB · Views: 200

Chromatischism

Major Contributor
Forum Donor
Joined
Jun 5, 2020
Messages
4,800
Likes
3,744
So what do you think ?
Sorry if it wasn't clear, but you are getting bad directions.

On the All SPL tab, change your vertical (SPL) range to 45-105. Don't use the +/- zoom buttons. This way your graphs will be comparable to others and have 5 dB increments.

Also, use the camera icon to take a screenshot.
 

Χ Ξ Σ

Senior Member
Forum Donor
Joined
Jul 16, 2020
Messages
457
Likes
1,976
Location
UTC-8
Hi Kling75, I think there are some confusions here. What we were was suggesting was to change your Graph Axis Limits. The human ear is capable of detecting 1dB change in SPL, so we want to see 1dB increment in the vertical axis.

Two ways to achieve that. You can simply use the +/- bottoms to increase/decrease the vertical increment, or as Chromatischism suggested, set fixed numbers on Graph Axis Limits.

Here is an example. The attached Pic1 and Pic2 show the exact same frequency response. Pic1 uses the settings Chromatischism suggested, it shows some huge ups and downs. Pic2 uses your latest settings, the ups and downs are much more compressed, so that unevenness is much less visible.

I believe it would be beneficial for you to change your graph settings. It would simply reveal more information.
Pic1.pngPic2.png
 
OP
Kling75

Kling75

Active Member
Forum Donor
Joined
Jul 27, 2020
Messages
164
Likes
173
Location
Switzerland
Hi Kling75, I think there are some confusions here. What we were was suggesting was to change your Graph Axis Limits. The human ear is capable of detecting 1dB change in SPL, so we want to see 1dB increment in the vertical axis.

Two ways to achieve that. You can simply use the +/- bottoms to increase/decrease the vertical increment, or as Chromatischism suggested, set fixed numbers on Graph Axis Limits.

Here is an example. The attached Pic1 and Pic2 show the exact same frequency response. Pic1 uses the settings Chromatischism suggested, it shows some huge ups and downs. Pic2 uses your latest settings, the ups and downs are much more compressed, so that unevenness is much less visible.

I believe it would be beneficial for you to change your graph settings. It would simply reveal more information.
View attachment 84692View attachment 84693


I am sorry, this is quite a challenge,,,,,,i should have prepared better. I tried to generate the requested graphics here.1/6 Smoothing and without.
 

Attachments

  • 1:6.png
    1:6.png
    281.7 KB · Views: 166
  • 2:3.png
    2:3.png
    194.1 KB · Views: 190
  • 2:4.png
    2:4.png
    299.4 KB · Views: 174
  • NS.png
    NS.png
    339.7 KB · Views: 177
  • Ns1.png
    Ns1.png
    395.5 KB · Views: 193
  • NS2.png
    NS2.png
    393.5 KB · Views: 163
OP
Kling75

Kling75

Active Member
Forum Donor
Joined
Jul 27, 2020
Messages
164
Likes
173
Location
Switzerland
And some more..
 

Attachments

  • 130:-40.16 smoothing.png
    130:-40.16 smoothing.png
    289.4 KB · Views: 116
  • 130:40.no smoothing.png
    130:40.no smoothing.png
    322.8 KB · Views: 136

Absolute

Major Contributor
Forum Donor
Joined
Feb 5, 2017
Messages
1,085
Likes
2,131
Well, I think the measurements look good. What room correction have you used and how did it look before?

The thing about in-room frequency response is that no one can tell by frequency response alone whether or not it sounds good. This is because the combination of the speaker's dispersion (off-axis response) and room acoustics will result in a given natural frequency response measured in steady-state. Changing the speaker or room acoustics will result in a different frequency response that may or may not sound better.

We cannot accurately predict the sound quality on steady-state frequency response alone because the human ears does not analyse/experience the sound in the same way a microphone does.

From Floyd Toole on this;

As the "creator" of the "new Harman target curve" I can clear up some misunderstandings. Those who have the 3rd edition of my book can see where the curve came from - Figure 12.4. It is nothing more than the steady-state room curve that results from measuring any of several forward-firing loudspeakers that have been awarded very high ratings in double-blind listening tests. These steady-state room curves are substantially predictable from the "early reflections" curve in the spinoramas, as is illustrated.

Now, if you measure such a curve or something very close to it, and your speakers are conventional forward firing designs, it means that you probably have chosen well. Small tilt-like deviations may be seen and broadband tone-control-like adjustments can be made to achieve a satisfactory overall spectral balance. No small detail adjustments should be made because it is highly likely that they are acoustical interference (non-minimum-phase) phenomena that two ears and a brain interpret as innocent spaciousness - room sound. "Correcting" these is likely to degrade the audible performance of truly good loudspeakers - unfortunately this behavior is not uncommon in auto-EQ algorithms created by companies that do not make loudspeakers. Their marketing philosophy is that their magic can make any loudspeaker in any room into a perfect system. Sorry, but a small omni mic and an analyzer are not the equivalent of two ears and a brain. It is not uncommon to be forced to override auto EQ with manual adjustments to restore the inherent sound quality of excellent loudspeakers. In some cases the "off" icon is the preferred solution.

The simple fact is that a steady-state room curve is not accurately descriptive of sound quality - comprehensive anechoic data are remarkably capable, but such data are rare.

The Harman curve is not a "target" in the sense that any flawed loudspeaker can be equalized to match it and superb sound will be the reward. The most common flaws in loudspeakers are resonances (which frequently are not visible in room curves) and irregular directivity (which cannot be corrected by equalization). The only solution to both problems is better loudspeakers, the evidence of which is in comprehensive anechoic data.

Remember, the Harman curve relates to conventional forward-firing loudspeaker designs. Legitimate reasons for differences are different loudspeaker directivities - omni, dipoles, etc. - or rooms that are elaborately acoustically treated, or both.

If a "target' curve has been achieved, and the sound quality is not satisfactory, the suggestion is often to go into the menu, find the manual adjustment routine, and play around with the shape of the curve until you or your customer like the sound. This is not a calibration. This is a subjective exercise in manipulating an elaborate tone control. Once set it is fixed, and in it will be reflected timbral features of the music being listened to at the time. In other words, the circle of confusion is now included in the system setup. By all means do it, but do not think that the exercise has been a "calibration". Old fashioned bass & treble tone controls and modern "tilt" controls are the answer and they can be changed at will to compensate for personal taste and excesses or deficiencies in recordings. Sadly, many "high end" products do not have tone controls - dumb. It is assumed that recordings are universally "perfect" - wrong!

All that said, equalization of steady-state room curves at low frequencies is almost mandatory in small rooms. Multiple subwoofers can reduce seat-to-seat variations so that the EQ works for more than one listener - Chapter 8.


Read more about it here thanks to our good member @thewas_ ; https://www.audiosciencereview.com/...e-targets-room-eq-and-more.10950/#post-307665
 

tuga

Major Contributor
Joined
Feb 5, 2020
Messages
3,984
Likes
4,285
Location
Oxford, England

Yes.
Change top SPL from 120 to 100dB, bottom SPL from 10 to 50dB, click "Apply Settings".

And perhaps change smoothing to 1/12 or 1/24 octave.
 

Nybto

Active Member
Forum Donor
Joined
Nov 14, 2018
Messages
113
Likes
110
Location
Bonn, Germany
Ok thanks, the treble from the Focals Sopra are "intense" , with this Correction, i can listen to high volumes without fatigue....
I can't comment on the REW but have the same issue with Focal Electra 1028. I have been experimenting with an LPad.. I was wondering how much you had to dial down the treble with the REW to get this?
 

Absolute

Major Contributor
Forum Donor
Joined
Feb 5, 2017
Messages
1,085
Likes
2,131
I can't comment on the REW but have the same issue with Focal Electra 1028. I have been experimenting with an LPad.. I was wondering how much you had to dial down the treble with the REW to get this?
EDIT; Whoops, wrong speaker. But I'll let it stand anyway to illustrate what to look for and how to decide some possible solutions. The speaker I show is the 1037 BE.


Looking at Stereophile's measurements it's no surprise that the treble comes off as too hot.

This measurement is measured quasi-anechoic and averaged over different angles in near-field. It shows the treble to be rising from 4-10 khz, a typical trick utilized to fool you into thinking "this tweeter is fast and has plenty of air and sparkle!".
Works wonders in A-B comparisons against more neutral speakers and for shorter sessions, but gets tiring very quickly. More often than not this kind of response is common in AMT, Ribbon and BE tweeters to give the speaker that "impressive transparency."
Also notice the overall banana-shape of the curve. I don't know if you can trust these measurements enough below 500 hz to say that it's accurate in this case, but in general such a shape is commonly referred to as "boom-tizz", meaning you have excessive bass and treble.

focalelectra.jpg


If we look at the normalized off-axis response below we can also see that we have a sudden jump around 3 kHz in dispersion width that will make that region stand out even more due to higher energy in the reflected sound from sidewalls. This may be adjusted for a little bit in the direct sound, but we'll check that out with an averaged in-room response in the last picture.

707Focfig4.jpg


Below we can see an averaged response from 6 different locations around the sweet spot that usually tells a better story about how something sounds in our perception than any other single measurement. This clearly tells a story off a speaker with elevated treble response in the most critical/sensitive area of our hearing. Based on this measurement I'd say it's worth to try a simple PEQ-filter targeted at 5 kHz with a Q factor of around 2-3 and around -3 dB to -4,5 dB depending on how it sounds.

Without measuring this in REW and looking at it in the EQ-section, it's a simplified guesstimate that may or may not hit its mark.

707Focfig6.jpg
 
Last edited:
Top Bottom