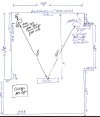
I am working on my listening room and I have been placing absorption and some diffusion. I have attached some REW data and I am looking at what the data is telling people about the room. Is there any major issues that I need to go after. I am not the best at interpreting the data. The system is klipsch two way Jubilees with a KPT 1802 sub. I am all digital and the sweeps were made with only crossovers and a high shelf filter to compensate for the Compression drivers on the horns natural roll off. Once I have the room where it needs to be I will use audiolense to time align the drivers and room correct. I look forward to feedback. Room feels dead in some ways.

-
WANTED: Happy members who like to discuss audio and other topics related to our interest. Desire to learn and share knowledge of science required. There are many reviews of audio hardware and expert members to help answer your questions. Click here to have your audio equipment measured for free!
You are using an out of date browser. It may not display this or other websites correctly.
You should upgrade or use an alternative browser.
You should upgrade or use an alternative browser.
Please provide feedback.
- Thread starter charbug
- Start date
- Thread Starter
- #2
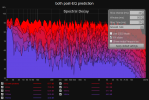
Cool system! Quick look shows speaker response is very accentuated in mid-band (1/6 smoothing):

You need to tune the crossover/filtering to fix that. I have drawn a sloping down line which is the target you want to have for the system+room. Given that, you may want to pull down the peaks around 200 Hz.
You need to tune the crossover/filtering to fix that. I have drawn a sloping down line which is the target you want to have for the system+room. Given that, you may want to pull down the peaks around 200 Hz.
- Thread Starter
- #5
I have worked really hard to get low end decay times under control and I believe early reflections need more work. The biggest thing you can sense is the room has gotten a dead like character but I guess there is a tradeoff on everything you do.
ernestcarl
Major Contributor
I have worked really hard to get low end decay times under control and I believe early reflections need more work. The biggest thing you can sense is the room has gotten a dead like character but I guess there is a tradeoff on everything you do.
The room doesn't seem too dead to me -- but, rather already well balanced -- based on your measurements. Playing around a little with PEQs should be sufficient (assuming xo are already done well enough, too) to bring back that missing "life" you feel lost in the overall system after acoustic treatment. I presume headroom and directivity of the speakers, given the looks of the design, is good to excellent so lots of EQ above the bass response should be "a-okay".


Maybe a little more manual HF shelving boost or adjustments at 5 or 10kHz according to your listening test results is all that's needed to get it dialed in just right... and, maybe a little more or less LS bass boost.
Normally, one would EQ left and right separately, but, for the sake of expediency the ff. -- nothing more than a simple example -- might suffice.
Attachments
Can you say more about the crossover settings? There isn't much CD compensation to be seen. In fact, it almost looks like it's playing full tilt from about 1Khz? Though I suspect that the actual crossover is a bit lower?I am all digital and the sweeps were made with only crossovers and a high shelf filter to compensate for the Compression drivers on the horns natural roll off.
Do you have measurements of the individual drivers? Best form 1m distance? That should give a better idea of the response of the individual parts, and will help shape the crossover.
Once fixed, you can concentrate on whatever the room does.
- Thread Starter
- #8
The crossovers are at 100 for the bass bin and sub, and the Bass Bin and CD cross at 600.
A little history. I have been working on this project for sometime and last year I got the equipment (Lynx Hilo) and got Jriver running to do the convolution engine. After that I worked with Mitch Barnett and use audiolense to generate crossovers and room correct. It worked out great but at that time I knew the room needed more help. So Mitch gave me a file to use in Jriver that had crossovers only, no time alignment or PEQ. I have been using that file to generate sweeps and look at the effectiveness of the absorption I have been adding.
So the room is looking pretty good?? I am thinking about spending a little money to add more diffusion. Do you guys think there are any real benefit to adding more diffusion?
I do have a quick question on REW, is there a quick and easy method to look at and compare sweeps to determine if the moving around of absorption panels is helping any? Trying to compare waterfalls stink. There has to be a simple way to look at a sweep compared to another and determine if the absorption panels are better in sweep A vs B.
The bottom line is once I get the room where I want it I will get with Mitch and have a new audiolense file generated for correction.
From what I see, priority should be on the crossover, then do the room correction.The bottom line is once I get the room where I want it I will get with Mitch and have a new audiolense file generated for correction.
At 600 Hz you seem to have a wide and deep hole in the response. Question is: why? It’s probably not the room.
ernestcarl
Major Contributor
I do have a quick question on REW, is there a quick and easy method to look at and compare sweeps to determine if the moving around of absorption panels is helping any? Trying to compare waterfalls stink. There has to be a simple way to look at a sweep compared to another and determine if the absorption panels are better in sweep A vs B.
The bottom line is once I get the room where I want it I will get with Mitch and have a new audiolense file generated for correction.
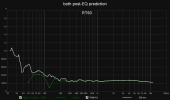
Nothing looks amiss in your waterfall graph. There is some excessive energy below 40Hz, but it doesn't seem to ring too bad. Moving absorber panels or adding diffusion / scatter panels around, you could look at the ETC, spectral decay, and spectrograms of the left and right channels -- check that they're not too dissimilar -- ~200 - 500 Hz in the left has a bit more moderate
Last edited:
Do I read your diagram correctly that the distance between speaker centers is 10 feet? If so, you only have 18 degrees stereo angle when it should be 30. Before looking at reflection points and decay times I would see what difference it makes to move the sofa 6 feet forward.
Edit: Just to clarify, I mean difference in how it sounds, not how it measures.
Edit: Just to clarify, I mean difference in how it sounds, not how it measures.
- Thread Starter
- #12
Yes you are reading correctly. I spent weeks a year or so ago finding the best locations for the speakers. Trust me moving the speakers or sofa inches make a huge difference. The biggest thing that gets you on moving the speakers / sofa is the Bass response. In my room which is not even close to being symmetrical it is very hard to find a sweet spot. I worked with Mike Major from GIK for a few days moving things around based on his experience and when I was working with Mitch Barnett to generate a filter I moved things around and unfortunately the spot I am in now measures the best and sounds the best. One thing I have not played around with is the speaker toe in and I need to try an optimize that by looking at ECT data. Any recommendation on how to use REW to adjust Toe in would be appreciated.
""Moving absorber panels or adding diffusion / scatter panels around, you could look at the ETC, spectral decay, and spectrograms of the left and right channels -- check that they're not too dissimilar -- ~200 - 500 Hz in the left has a bit more moderatestrong reflective energy than the right side between 15 - 35 ms (hint: look a the wavelet spect)""
Question from the above statement, how do I get view of Spectral decay in REW that is easy to make comparisons when I move things around? Can you take a snagit and show me how I should have it set up in REW?
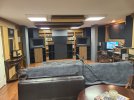
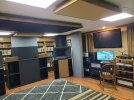
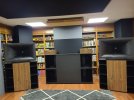
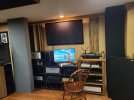
Here are a few more pics.
""Moving absorber panels or adding diffusion / scatter panels around, you could look at the ETC, spectral decay, and spectrograms of the left and right channels -- check that they're not too dissimilar -- ~200 - 500 Hz in the left has a bit more moderate
Question from the above statement, how do I get view of Spectral decay in REW that is easy to make comparisons when I move things around? Can you take a snagit and show me how I should have it set up in REW?
Here are a few more pics.
Attachments
ernestcarl
Major Contributor
Yes you are reading correctly. I spent weeks a year or so ago finding the best locations for the speakers. Trust me moving the speakers or sofa inches make a huge difference. The biggest thing that gets you on moving the speakers / sofa is the Bass response. In my room which is not even close to being symmetrical it is very hard to find a sweet spot. I worked with Mike Major from GIK for a few days moving things around based on his experience and when I was working with Mitch Barnett to generate a filter I moved things around and unfortunately the spot I am in now measures the best and sounds the best. One thing I have not played around with is the speaker toe in and I need to try an optimize that by looking at ECT data. Any recommendation on how to use REW to adjust Toe in would be appreciated.
""Moving absorber panels or adding diffusion / scatter panels around, you could look at the ETC, spectral decay, and spectrograms of the left and right channels -- check that they're not too dissimilar -- ~200 - 500 Hz in the left has a bit more moderatestrongreflective energy than the right side between 15 - 35 ms (hint: look a the wavelet spect)""
Question from the above statement, how do I get view of Spectral decay in REW that is easy to make comparisons when I move things around? Can you take a snagit and show me how I should have it set up in REW?
Here are a few more pics.
With regards to the toe-in, I'd probably just look at the on- and off-axis responses -- both at the center listening position and the side seats. Pick whatever looks the most linear overall. Although, listening tests should be the ultimate deciding factor, IMO...
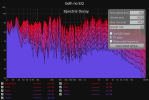
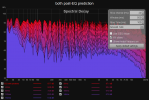
There isn't much that I can say below 500 Hz in your spectral decay views other than some uneveness or lumpiness here and there between the left and right which is common enough in any room (treated or not). But, more importantly, there are no obviously prominent, long-decaying room resonances to be found. Really, that's as far as I can tell from the spectral decay graphs of your single-point measurement at the MLP.
Now, if we want to observe some more finer differences, we could use other views already mentioned before, and maybe one more extra:
Wavelet spectrogram (1/6 res, 35 dB scale, normalized):


Envelope time curve (ETC):

Filtered IR (morlet/wavelet transform):


None of these particularly look egregious or god-awful "broken" to me... other than being a little warped or "imperfect" -- in audibility terms... maybe sounding just a tad less "defined" perhaps.
Any remaining discrete late arriving energy peaks/reflections still look rather low and much less in level than the initial peak; none appear to significantly resonate over time.
Similar threads
- Replies
- 5
- Views
- 699
- Replies
- 4
- Views
- 646
- Replies
- 3
- Views
- 446
- Replies
- 0
- Views
- 381
- Replies
- 5
- Views
- 456