• WANTED: Happy members who like to discuss audio and other topics related to our interest. Desire to learn and share knowledge of science required. There are many reviews of audio hardware and expert members to help answer your questions. Click here to have your audio equipment measured for free!

Phono Cartridge Response Measurement Script

OP
JP

JP

Major Contributor
Joined
Jul 4, 2018
Messages
2,292
Likes
2,468
Location
Brookfield, CT
Someone post one of the files that are doing this so I can check it out please?

The test version isn't auto-trimming the file as the detection threshold has been increased (defeated) due to STR-100. 40Hz is 22dB below reference level on that record, and that's being compensated after the FFT process. (I)RIAA filters are being applied before the trimming while the STR-100 compensation is after. The function had issues catching the beginning of the signal on STR-100 so I set the threshold so it'd principally detect everything.

You can adjust topdb to try to tune the auto-trim, or just manually trim the files.
 
Last edited:
OP
JP

JP

Major Contributor
Joined
Jul 4, 2018
Messages
2,292
Likes
2,468
Location
Brookfield, CT
Also: make sure you plug in a stereo wave file onto V13+. You can even fake it by copying the left channel if that is all you have.

No one has that code.
 
OP
JP

JP

Major Contributor
Joined
Jul 4, 2018
Messages
2,292
Likes
2,468
Location
Brookfield, CT
i wish i could post some plots for you guys, but im on a windows 7 machine and between trying to download old versions of python and me having absolutely zero clue as to what im doing, its just not looking like its going to happen.

i can provide some reference though with the repaired stylus compared to all the rest i own using plots from a music sample. jp plotted this for me which is my oldest stylus which is visibly worn under the microscope and has audibly more surface noise than the rest of my styli which have either pretty much unused diamonds or one that has seen very light use. my tascam interface has a roll off after 15k or so for some reason, so thats what youre seeing.
narud_V15VMR_CA-Nano L.png

narud V15-VMR_CA Nano.png
 
OP
JP

JP

Major Contributor
Joined
Jul 4, 2018
Messages
2,292
Likes
2,468
Location
Brookfield, CT
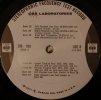
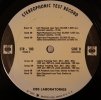
Got a few different versions of STR 100 in late this week. It was supposed to be sealed copies of Issue 1, Issue 2, and an NM second copy of Issue 1. The two Issue 1s turned out to be Issue 3s, but a different version Issue 3 than the latest non-gatefold version. Good, glad that's clear :)

Old (gatefold) Issue 3:

R5__3590.JPG

New Issue 3:

R5__3598.JPG

Issue 2 is on the old style label but does say Issue 2. I'm still trying to get an "Issue 1" copy.

CBS STR 100 Versions.png


CBS STR 100 Versions-2.png
 
Last edited:

morillon

Major Contributor
Joined
Apr 19, 2022
Messages
1,373
Likes
276
small "ps"...
could someone with the shure ttr117 explain to me the nature of the tri-tones test it offers?
see even better...will take a small scan or photo of the document that accompanies it...?
(often interesting to read the very advanced approaches-explains offert with lp tests of the 70s early 80s ..)
sorry for the automatic translation
thank you
;-)
 
Last edited:

morillon

Major Contributor
Joined
Apr 19, 2022
Messages
1,373
Likes
276
another small "ps":
may not be known here..
but at my request pkane which does a huge development work "for all" with multitone, has integrated the correction "anti" riaa into its software
incredible pkane ..thank you...
;-)
 

Thomas_A

Major Contributor
Forum Donor
Joined
Jun 20, 2019
Messages
3,459
Likes
2,446
Location
Sweden
I've used the 96 kHz version but Is there an RIAA and inverse RIAA for 48 kHz sampling around, to use in e.g. Audacity? Or is it just to resample and use?
 
OP
JP

JP

Major Contributor
Joined
Jul 4, 2018
Messages
2,292
Likes
2,468
Location
Brookfield, CT
small "ps"...
could someone with the shure ttr117 explain to me the nature of the tri-tones test it offers?
see even better...will take a small scan or photo of the document that accompanies it...?
(often interesting to read the very advanced approaches-explains offert with lp tests of the 70s early 80s ..)
sorry for the automatic translation
thank you
;-)

117 is meant for consumers so the test are designed to create audible defects, and there is no technical explanation that comes with that record. The principal is similar to 103, only not as comprehensive:

Doc - Feb 5, 2023 - 10-47 AM.jpg
 

morillon

Major Contributor
Joined
Apr 19, 2022
Messages
1,373
Likes
276
THANKS..
I know the ttr103..that he owns
and I know well the interest and in the end the approach of this time..
but the ttr117 ... which marked, it seems to me, the end of the development of test discs at shure in 1982 , have a tri-tone test of which I do not know the detail and the approach ..
which explains my curiosity...
"Band Three: Trackability test at six modulation levels using a complex test tone of 200 Hz, 2100 Hz, and 17,000 Hz."

;-)
ps the ttr 103 has been considered such an extreme case that it is often almost inadvisable ....
and its test signals were abandoned in the discs which succeeded it

sorry for this "off topic"
 
Last edited:

Thomas_A

Major Contributor
Forum Donor
Joined
Jun 20, 2019
Messages
3,459
Likes
2,446
Location
Sweden
The latest code for the script can be found here. I intend to get this on GitHub at some point, but as I'm not a developer I've only read code from repos and have never had to use them for workflow, so I've a learning curve. Patience appreciated.

You will need Python to run this with scipy, matplotlib, numpy, and librosa libraries installed. Note that I work on a Mac so there may be some methods and nomenclatures that are OS dependent, particularly around file handling. In the future I'll test against Windows as well to ensure it is agnostic.

Also note that indents are important with Python, so you want to ensure the formatting doesn't change when you copy/paste.

Code:
"""
PLEASE READ
To use this script you need to edit HOME to the directory where the .wav file is.
The .wav file can be any monotonic frequency sweep either up or down in frequency but
it must be trimmed at both ends to remove any leading silence. Frequencies below 1kHz are
ignored since virually all cartridges are well behaved below 1kHz.

The info_line should be alpha-numeric with entries separated by " / " only.  The script
will save a .png file that is named from the info line, replacing " / " with "_".  As
example "this / is / a / test" will create a file named "this_is_a_test.png"

plotstyle =

                1 - traditional
                2 - dual axis (twinx)
                3 - dual plot


VERSION 8C

"""

from scipy import signal
from scipy.io.wavfile import read
from pathlib import Path
import matplotlib.pyplot as plt
import numpy as np
import datetime
import os
import librosa


#edit here to add a HOME directory, etc.

#HOME = '/Users/user/Documents/' #THIS IS NOT NEEDED IF RAN FROM A FILE

_FILE = 'wavefile.wav'

infoline =  'Cart / Load / Record'


roundlvl = 2
plotstyle = 2
plotdataout = 0

ovdylim = 0
ovdylimvalue = [-25,5]

topdb = 20
framelength = 512
hoplength = 128


#end Edit

print('Input File:   ' + str(_FILE))
print('Info Line:    ' + str(infoline))


def align_yaxis(ax1, ax2):
    y_lims = np.array([ax.get_ylim() for ax in [ax1, ax2]])

    # force 0 to appear on both axes, comment if don't need
    y_lims[:, 0] = y_lims[:, 0].clip(None, 0)
    y_lims[:, 1] = y_lims[:, 1].clip(0, None)

    # normalize both axes
    y_mags = (y_lims[:,1] - y_lims[:,0]).reshape(len(y_lims),1)
    y_lims_normalized = y_lims / y_mags

    # find combined range
    y_new_lims_normalized = np.array([np.min(y_lims_normalized), np.max(y_lims_normalized)])

    # denormalize combined range to get new axes
    new_lim1, new_lim2 = y_new_lims_normalized * y_mags
    ax1.set_ylim(new_lim1)
    ax2.set_ylim(new_lim2)
 

#Needed to steal Matlab's flat top window

def ft_window(n):
    w = []
    a0 = 0.21557895
    a1 = 0.41663158
    a2 = 0.277263158
    a3 = 0.083578947
    a4 = 0.006947368
    pi = np.pi

    for x in range(0,n):
        w.append(a0 - a1*np.cos(2*pi*x/(n-1)) + a2*np.cos(4*pi*x/(n-1)) - a3*np.cos(6*pi*x/(n-1)) + a4*np.cos(8*pi*x/(n-1)))
    return w


audio, Fs = librosa.load(_FILE, sr=None)


filelength = audio.shape[0] / Fs
print('Sample Rate:  ' + str("{:,}".format(Fs) + 'Hz'))
print(f"Length:       {filelength}s")


trimmedaudio, index = librosa.effects.trim(audio, top_db=topdb, frame_length=framelength, hop_length=hoplength)
input_sig = (trimmedaudio* 32767).astype(int) #scale samples and convert to int

print(f"In/Out (s):   {index / Fs}")


frequency = []
amplitude = []

frequency2h = []
amplitude2h = []

frequency3h = []
amplitude3h = []

freqout = []
ampout = []

freqout2h = []
ampout2h = []

freqout3h = []
ampout3h = []

F = int(Fs/100)
win = ft_window(F)

#For Fs sampling use small Fs/100 FFT's so frequency is f/100
#All common sampling rates are divisible by 100
#First try, no overlap and flat top window

#Find the minimum and maximum frequencies and flip the data if the sweep
#is going down in frequency.

y = abs(np.fft.rfft(input_sig[0:F]*win))
minf = np.argmax(y)

y = abs(np.fft.rfft(input_sig[len(input_sig)-F:len(input_sig)]*win))
maxf = np.argmax(y)

if maxf < minf:
    maxf,minf = minf,maxf
    input_sig = np.flipud(input_sig)


for x in range(0,len(input_sig)-F,F):
    y = abs(np.fft.rfft(input_sig[x:x+F]*win))
    f = np.argmax(y) #use largest bin
    if f >=10:
        frequency.append(f*100)
        amplitude.append(y[f])
    if 2*f<F/2-2 and f >= 10:
        f2 = np.argmax(y[(2*f)-2:(2*f)+2])
        frequency2h.append(f*100)
        amplitude2h.append(y[2*f-2+f2])
    if 3*f<F/2-2 and f >= 10:
        f3 = np.argmax(y[(3*f)-2:(3*f)+2])
        frequency3h.append(f*100)
        amplitude3h.append(y[3*f-2+f3])
 
amp = 0
count = 0
x = minf*100

for x in range(minf*100,(maxf+1)*100,100):
    for y in range(0,len(frequency)):
        if frequency[y] == x:
            amp = amp + amplitude[y]
            count = count + 1
    if count != 0:
        freqout.append(x)
        ampout.append(20*np.log10(amp/count))
    amp = 0
    count = 0

amp = 0
count = 0
x = minf*100

for x in range(minf*100,(maxf+1)*100,100):
    for y in range(0,len(frequency2h)):
        if frequency2h[y] == x:
            amp = amp + amplitude2h[y]
            count = count + 1
    if count != 0:
        freqout2h.append(x)
        ampout2h.append(20*np.log10(amp/count))
    amp = 0
    count = 0
 

amp = 0
count = 0
x = minf*100

for x in range(minf*100,(maxf+1)*100,100):
    for y in range(0,len(frequency3h)):
        if frequency3h[y] == x:
            amp = amp + amplitude3h[y]
            count = count + 1
    if count != 0:
        freqout3h.append(x)
        ampout3h.append(20*np.log10(amp/count))
    amp = 0
    count = 0


b, a = signal.iirfilter(3,.5, btype='lowpass') #filter some noise
ampout = signal.filtfilt(b,a,ampout)
ampout2h = signal.filtfilt(b,a,ampout2h)
ampout3h = signal.filtfilt(b,a,ampout3h)


norm = ampout[0]
ampout = ampout-norm #amplitude is in dB so normalize by subtraction at [0]
ampout2h = ampout2h-norm
ampout3h = ampout3h-norm


deltah = round((max(ampout)), roundlvl)
deltal = abs(round((min(ampout)), roundlvl))


print('Min Freq:     ' + str("{:,}".format(minf * 100) + 'Hz'))
print('Max Freq:     ' + str("{:,}".format(maxf * 100) + 'Hz'))

print('Min Ampl:     ' + str(round((min(ampout)), 4)) + 'dB')
print('Max Ampl:     ' + str(round((max(ampout)), 4)) + 'dB')
print('Delta:        ' + str(round((max(ampout) - min(ampout)), 4)) + 'dB')

print('Frequency:    ' + str(len(freqout)) + ' list elements')
print('Amplitude:    ' + str(len(ampout)) + ' list elements')
print('Amplitude 2h: ' + str(len(ampout2h)) + ' list elements')
print('Amplitude 3h: ' + str(len(ampout3h)) + ' list elements')


if plotdataout == 1:

    dampout = [*ampout, *[''] * (len(freqout) - len(ampout))]
    dampout2h = [*ampout2h, *[''] * (len(freqout) - len(ampout2h))]
    dampout3h = [*ampout3h, *[''] * (len(freqout) - len(ampout3h))]

    print('\nPlot Data: (freq, ampl, 2h, 3h)\n')

    dataout = list(zip(freqout, dampout, dampout2h, dampout3h))
    for fo, ao, ao2, ao3 in dataout:
        print(fo, ao, ao2, ao3, sep=', ')


plt.rcParams["xtick.minor.visible"] =  True
plt.rcParams["ytick.minor.visible"] =  True

if plotstyle == 1:
        fig, ax1 = plt.subplots(1, 1, figsize=(14,6))
 
        ax1.semilogx(freqout,ampout,color = 'b', label = 'Freq Response')
        ax1.semilogx(freqout2h,ampout2h,color = 'g', label = '2nd Harmonic')
        ax1.semilogx(freqout3h,ampout3h,color = 'r', label = '3rd Harmonic')

        ax1.set_ylabel("Amplitude (dB)")
        ax1.set_xlabel("Frequency (Hz)")

        ax1.legend(loc=4)
 

if plotstyle == 2:
        fig, ax1 = plt.subplots(1, 1, figsize=(14,6))
        ax2 = ax1.twinx()

        if max(ampout) <7:
            ax1.set_ylim(-25, 7)

        if max(ampout) < 4:
            ax1.set_ylim(-25,5)
 
        if max(ampout) < 2:
            ax1.set_ylim(-29,3)

        if max(ampout) < 0.5:
            ax1.set_ylim(-30,2)

        if ovdylim == 1:
            ax1.set_ylim(*ovdylimvalue)
 
        ax1.semilogx(freqout,ampout,color = 'b', label = 'Freq Response')
        ax2.semilogx(freqout2h,ampout2h,color = 'g', label = '2nd Harmonic')
        ax2.semilogx(freqout3h,ampout3h,color = 'r', label = '3rd Harmonic')

        align_yaxis(ax1, ax2)

        ax1.set_ylabel("Amplitude (dB)")
        ax2.set_ylabel("Distortion (dB)")
        ax1.set_xlabel("Frequency (Hz)")

        fig.legend(loc=4, bbox_to_anchor=(0.899, 0.11))
 

if plotstyle == 3:
        fig, (ax1, ax2) = plt.subplots(2, 1, sharex=True, figsize=(14,6))

        ax2.grid(True, which="major", axis="both", ls="-", color="black")
        ax2.grid(True, which="minor", axis="both", ls="-", color="gainsboro")

        if max(ampout) <= 1.75 and min(ampout) >= -1.75:
                ax1.set_ylim(-2,2)

        ax1.semilogx(freqout,ampout,color = 'b', label = 'Freq Response')
        ax2.semilogx(freqout2h,ampout2h,color = 'g', label = '2nd Harmonic')
        ax2.semilogx(freqout3h,ampout3h,color = 'r', label = '3rd Harmonic')

        ax1.set_ylabel("Amplitude (dB)")
        ax2.set_ylabel("Distortion (dB)")
        ax2.set_xlabel("Frequency (Hz)")

        ax1.legend(loc=4)
        ax2.legend(loc=4)
 

ax1.grid(True, which="major", axis="both", ls="-", color="black")
ax1.grid(True, which="minor", axis="both", ls="-", color="gainsboro")


bbox_args = dict(boxstyle="round", color='b', fc='w', ec='b', alpha=1)
arrow_args = dict(arrowstyle="->")

ax1.annotate('+' + str(deltah) + ', ' + u"\u2212" + str(deltal) + ' dB', color='b', \
             xy=(1000,0), xycoords='data', \
             xytext=(-15, -20), textcoords='offset points', \
             ha="left", va="center", \
             bbox=bbox_args, \
             #arrowprops=arrow_args \
             )


ax1.set_xticks([1000,10000])
ax1.set_xticklabels(['1k','10k'])

ax1.set_title(infoline + "\n", fontsize=16)


mod_date = datetime.datetime.fromtimestamp(os.path.getmtime(_FILE))

plt.figtext(.17, .13, infoline + "\n" + _FILE + "\n" + \
            mod_date.strftime("%b %d, %Y %H:%M:%S"), fontsize=8)
 
plt.savefig(infoline.replace(' / ', '_') +'.png', bbox_inches='tight', pad_inches=.75, dpi=96)

plt.show()

print('\nDone!')
-Version 8C, Dec 23, 2022-


This is an example plot done with this version of the code:

View attachment 258361

We'll put some type of instructional here on how to install Python and get this working. If someone wants to volunteer to (help) write that, I'd be very appreciative. We'd need one for Windows, and one for Mac. I'm going to assume Linux folks can figure it out on their own. :cool:
JP,

Question regarding the double y-axis. Can the distortion scale (Y2) be set having the same range = ticks and lines as the amplitude scale (Y1)? Meaning setting the distortion scale from -18 to -52 dB in the example? This would be easier to read. Also, it would be nice to give THD at 1 kHz and 5 kHz as numbers.
 
OP
JP

JP

Major Contributor
Joined
Jul 4, 2018
Messages
2,292
Likes
2,468
Location
Brookfield, CT
JP,

Question regarding the double y-axis. Can the distortion scale (Y2) be set having the same range = ticks and lines as the amplitude scale (Y1)? Meaning setting the distortion scale from -18 to -52 dB in the example? This would be easier to read. Also, it would be nice to give THD at 1 kHz and 5 kHz as numbers.

You get it running? Plot style 1 uses the same scale.
 

Thomas_A

Major Contributor
Forum Donor
Joined
Jun 20, 2019
Messages
3,459
Likes
2,446
Location
Sweden
You get it running? Plot style 1 uses the same scale.
No, not yet. I look into it when the Denon test record arrives.
 

Thomas_A

Major Contributor
Forum Donor
Joined
Jun 20, 2019
Messages
3,459
Likes
2,446
Location
Sweden
I think and hope there will be a future thread regarding cartridge tests when there is a final script?

Basic info: Cartridge, stylus, loading, test record
Optional info: turntable and arm, age or hours of stylus
- frequency response and distortion graph
- frequency response and crosstalk graph

Each graph with standardised scale.
 

Thomas_A

Major Contributor
Forum Donor
Joined
Jun 20, 2019
Messages
3,459
Likes
2,446
Location
Sweden
You get it running? Plot style 1 uses the same scale.
What do I use to run it? I installed the 3.11 Pyton for OSX and have the IDLE shell but I do not know where to go from there. How do I get the imports? I do not have skills of this at all.

SyntaxError: multiple statements found while compiling a single statement
from scipy import signal
from scipy.io.wavfile import read
from pathlib import Path
import matplotlib.pyplot as plt
import numpy as np
import datetime
import os
 
OP
JP

JP

Major Contributor
Joined
Jul 4, 2018
Messages
2,292
Likes
2,468
Location
Brookfield, CT
3.11, or 3.11.1? The latter you can't install librosa as a dependent package hasn't been updated yet. I'm checking out 3.11 now.
 

Thomas_A

Major Contributor
Forum Donor
Joined
Jun 20, 2019
Messages
3,459
Likes
2,446
Location
Sweden
3.11, or 3.11.1? The latter you can't install librosa as a dependent package hasn't been updated yet. I'm checking out 3.11 now.
3.11.1
 
OP
JP

JP

Major Contributor
Joined
Jul 4, 2018
Messages
2,292
Likes
2,468
Location
Brookfield, CT

Uninstall that version and get 3.10.9 - it's an active branch that is receiving updates. If you go to 3.11 you're stuck without updates until the numba package compatibility is resolved.
 

Thomas_A

Major Contributor
Forum Donor
Joined
Jun 20, 2019
Messages
3,459
Likes
2,446
Location
Sweden
Uninstall that version and get 3.10.9 - it's an active branch that is receiving updates. If you go to 3.11 you're stuck without updates until the numba package compatibility is resolved.
Ok!
 
Top Bottom