- Joined
- Jan 15, 2020
- Messages
- 6,864
- Likes
- 16,811
Original article in German here https://www.soundandrecording.de/equipment/o-s-acoustics-dbs8-2-wege-monitor-im-test/

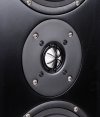
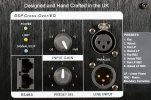
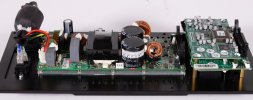
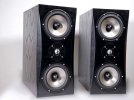
Translation of the measurement section:
Measurements
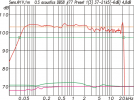
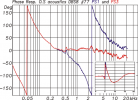
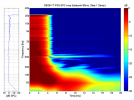
If we look at the frequency response on axis in Fig.1, we see an overall straight line with a small step at the crossover frequency at 2.5 kHz. This goes along with the use of the tweeter and a clear widening of the dispersion angle, especially in the vertical plane. Considering the diffuse field in the room as well as the direct sound, the 2 dB level reduction seems reasonable. In Fig.2 for the phase response of the DBS8 there are two curves: one for the minimum phase mode (Setup 1) and one for the linear phase mode (Setup 3). Linear phase is achieved from approx. 300 Hz upwards. Below 300 Hz, the phase rotates 360° through the acoustic and electrical high-pass filter. For an even lower linear phase equalisation, one would probably have had to accept a longer latency. The linear-phase presets have a 5 ms longer latency compared to the minimum-phase versions. The frequency response remains completely unchanged regardless. In the spectrogram from Fig.3 you can see a single narrow resonance just above 500 Hz, which is also visible in the frequency response by a small wobble - probably due to a cabinet mode between the front and the rear, which cannot be completely avoided despite the damping material.
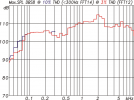
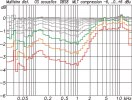
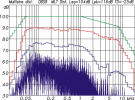
A quick look at the achievable levels shows for the sine burst measurement (Fig.4) about 105 dB below 500 Hz and about 110 dB above 500 Hz. A little more detail is provided by the multitone measurement in Fig.5 and Fig.6. The criteria for the maximum level in this measurement are maximum -20 dB total distortion (THD + IMD) and no more than 2 dB compression in several adjacent frequency bands compared to a measurement in the linear small signal range. The curves in Fig.05 clearly show that in the DBS8 first the woofers reach their limits and exceed the 2 dB compression where the tweeter is still linear. Fig.6 was derived from the measurement of the green curve, in which it is clearly visible that the woofers reach their limit while the tweeter still has reserves. In this measurement the DBS8 reaches an average level Leq of 104 dB and a peak profile level of Lpk 116 dB. All level values refer to 1 m distance in free field and full room.
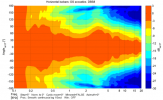
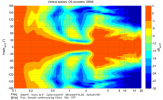
The directivity measurements in Fig.7 and Fig.8 show the special behaviour of a D'Appolito array especially in the vertical plane. While for the horizontal plane a mean opening angle of 1-10 kHz of approx. 140° with a standard deviation of 23° can still be reasonably given, this does not result in a meaningful value for the vertical isobars. Here, this special D'Appolito behaviour either fits the application and set-up or it does not.
In my opinion a shame they messed up the vertical directivity and sound power with the pseudo D'Appolito.
