• WANTED: Happy members who like to discuss audio and other topics related to our interest. Desire to learn and share knowledge of science required. There are many reviews of audio hardware and expert members to help answer your questions. Click here to have your audio equipment measured for free!

Measure your C50 in REW and tell us how your bass sounds!

NIN

Active Member
Joined
Oct 26, 2021
Messages
204
Likes
198
Thanks. Still looking for improvements but because it is a "normal" living room there are limitations to what I can do. I have still not played with DSP for the bass.
 

Hexspa

Senior Member
Joined
Sep 6, 2022
Messages
317
Likes
211
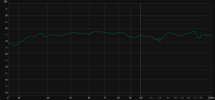
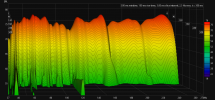
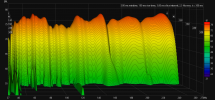
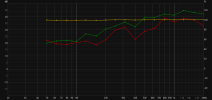
I don't know how to interpret the clarity measurements but here are mine. Please note that I took another measurement for the decay and waterfall plots because I had higher ringing ~120Hz that reduced 3-4dB the second time.

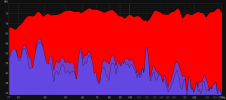
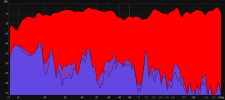
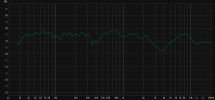
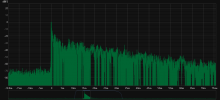
Bass decay shows impulse, 140 and 160ms, waterfall shows about 30dB on y-axis, full spl is variable smoothing, bass spl is no smoothing, impulse response envelope and clarity graphs are what they are. I only measured from 27Hz because that's A0 in musical terms and my sub doesn't play with accuracy to that range anyway.

This is post-EQ from 18 measurments around my listening position, nine in a grid then nine more at seated height, averaged then placed into EqualizerAPO. Speakers are Yamaha HS50 with HS10w subwoofer (quoted -10dB @ 30Hz) @ ~1m with a calculated level from REW of 74.4dB in a treated space of ~2500ft3 and irregular shape.

How does my bass sound? I take you to mean with the mains because without them it sounds just like a subwoofer. It sounds spacious, accurate and flat, slightly elevated but not overwhelming. My taste is not to have a ton of bass so it's fine. This calibration is for music creation more than enjoyment and a similar calibration I used before this worked well, allowing me to achieve the "translation" that audio people chase, as least in the low end. My plan is to swap out my mains when I can.

Let me note that 120Hz is a problem frequency for me right now. I had to use the high pass filters on my mains to 80Hz to get the most even response at that range. I tried 100Hz and inverting the subwoofer's polarity but none of that worked. Quarter wavelength is around 2' so I think it's either a desk bounce and/or a front wall reflection; I have no absorption behind the speakers except for two floor-to-ceiling 32"-wide fluffy superchunks in the corners. If I look at the minimum phase generation, I'm pretty sure it's not flat right there either. As far as I know, that means EQ is less effective there and that could be why there's more decay.
 

Attachments

  • bass-decay.png
    bass-decay.png
    55.3 KB · Views: 31
  • bass-decay-2.png
    bass-decay-2.png
    56.3 KB · Views: 28
  • bass-spl-smoothing.png
    bass-spl-smoothing.png
    23.1 KB · Views: 25
  • bass-waterfall.png
    bass-waterfall.png
    297.5 KB · Views: 30
  • bass-waterfall-2.png
    bass-waterfall-2.png
    291 KB · Views: 38
  • clarity.png
    clarity.png
    32.4 KB · Views: 35
  • full-spl-var.png
    full-spl-var.png
    26.5 KB · Views: 37
  • impulse-envelope.png
    impulse-envelope.png
    54.6 KB · Views: 28
Last edited:

Hexspa

Senior Member
Joined
Sep 6, 2022
Messages
317
Likes
211
In this case, the interpretation is trivial - the result is good and sufficient, because

From a greater distance, smaller values of C(D) can be measured (and heard), down to an inarticulate bass in ordinary rooms
Thanks for your response. Can you point me to a good resource on understanding these Clarity graphs? The REW help says it’s the ratio between direct and ? sound in dB but I’m not sure if lower or higher is more “clear” and why the lines would not be horizontal whether they should conform to a certain shape or what importance wiggles in the lines have. Thanks.
 

Flaesh

Senior Member
Joined
Jun 13, 2021
Messages
430
Likes
306
Location
Eburg
I think there is some discussion in this thread. As a metric of the quality of bass reproduction, these indicators are not generally accepted and are quite rough.
See also discussions about MATT test aka Stereophile Test disk 2 track #11.
Ideally, the D50 graph line is approximately horizontal between 99% and 100%
BTW here's an ordinary sound card:
1704622468416.png
 

Hexspa

Senior Member
Joined
Sep 6, 2022
Messages
317
Likes
211
I think there is some discussion in this thread. As a metric of the quality of bass reproduction, these indicators are not generally accepted and are quite rough.
See also discussions about MATT test aka Stereophile Test disk 2 track #11.
Ideally, the D50 graph line is approximately horizontal between 99% and 100%
BTW here's an ordinary sound card:
View attachment 340251
Thanks for this. I'll check out MATT and review this thread. Cheers.
 
Top Bottom