
maty
Major Contributor
https://www.audiocircle.com/index.php?topic=161371.msg1766197#msg1766197
by poseidonsvoice
by maty
Updated the graph: https://www.audiosciencereview.com/...hread-on-audio-product-sales.3118/post-264192
Resized and optimized
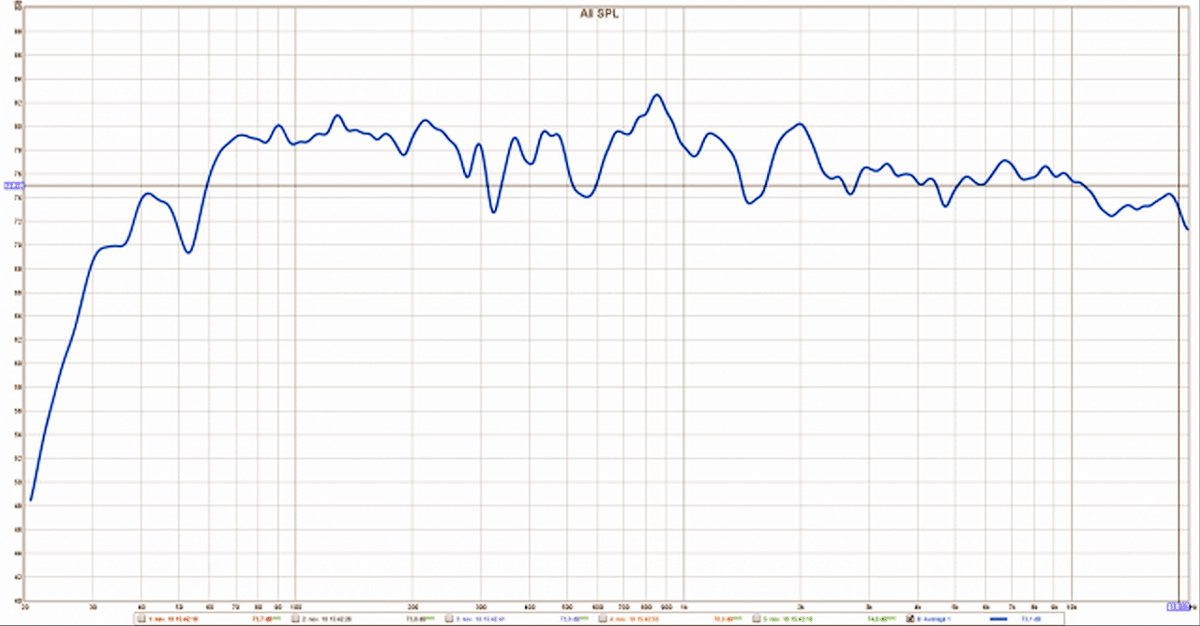
50 dB scale and a 1/12th octave horizontal smoothing.
by poseidonsvoice
In the graphs you posted, the 320dB vertical range makes the curves look purposefully and artificially flat. Great for marketing, but poor for engineering and seeing the truth. Tell the OP on Imgur to set it to a 50dB scale and try again. 1/12th or 1/6th octave smoothing for the horizontal range should give us a decent idea of the FR in a room which is the best you can do. Or tell the OP to take it back to KEF’s anechoic chamber to get it properly measured!
by maty
I know it is artificiallyflatsmoothed out, like many others graphs. The major difference with KEF Q100 is they have "V" response, easily modified with a new crossover taking advantage of the original components to spend money (Zvu) or with minimum-phase PEQ.
* Minimum Phase vs Linear Phase | Page 7 | Audio Science Review (ASR) Forum
* Minimum Phase vs Linear Phase | Page 16 | Audio Science Review (ASR) Forum
Let us see if someone is encouraged and makes complete measurements, without softening the frequency response like Zvu or Danny Richie.
But for now...
Updated the graph: https://www.audiosciencereview.com/...hread-on-audio-product-sales.3118/post-264192
Resized and optimized
50 dB scale and a 1/12th octave horizontal smoothing.
Last edited:
