You clearly do not know how it works and you clearly do not understand what virtual surround sound is.i know exactly how does it works and still you are wrong. This headset does have true 8.1.
As i said i can ear the sound comes from front or behind and every directions.

-
WANTED: Happy members who like to discuss audio and other topics related to our interest. Desire to learn and share knowledge of science required. There are many reviews of audio hardware and expert members to help answer your questions. Click here to have your audio equipment measured for free!
You are using an out of date browser. It may not display this or other websites correctly.
You should upgrade or use an alternative browser.
You should upgrade or use an alternative browser.
Master Complaint Thread About Headphone Measurements
- Thread starter amirm
- Start date
you clearly don't understand that you are talking about the Audeze Penrose here, and not the Mobius that DOES have true 8.1 UNLIKE the Penrose.You clearly do not know how it works and you clearly do not understand what virtual surround sound is.
How many drivers do you see:you clearly don't understand that you are talking about the Audeze Penrose here, and not the Mobius that DOES have true 8.1 UNLIKE the Penrose.
This is the Penrose...How many drivers do you see:
Do you even read when i say that you are still showing me the Penrose instead of the Mobius ?
You can't see on this picutre but each of the metal pieces are separated. This is not one piece under the 5 plastic bars but unfortunatly i can't find a picture to show you are wrong.
the description is wrong there are 4 drivers per earpiece they look like bars because it's planar drivers, not circular.
On the Penrose they are connected together but not on the Mobius.
the description is wrong there are 4 drivers per earpiece they look like bars because it's planar drivers, not circular.
On the Penrose they are connected together but not on the Mobius.
From the Audeze website:You can't see on this picutre but each of the metal pieces are separated. This is not one piece under the 5 plastic bars but unfortunatly i can't find a picture to show you are wrong.
the description is wrong there are 4 drivers per earpiece they look like bars because it's planar drivers, not circular.
They do know their own product I suppose.
let's make it's simple.
how would i know if a sound comes from front or behind if it was only one driver per earpiece ?
Try me.
I have both a 7.1 set up with speakers and this headset i know if it's virtual or real surround when playing games.
I can ear every single sound coming from behind and front and locate them unlike stereo.
So basicaly you are saying that i'm lying ? why would i ?
3D emulation. Psycho-acoustics at play. They introduce delays in the other channel, phase shifts, etc.let's make it's simple.
how would i know if a sound comes from front or behind if it was only one driver per earpiece ?
Try me.
I have both a 7.1 set up with speakers and this headset i know if it's virtual or real surround when playing games
Works also for binaural recordings played back over regular stereo headphones.
It's crazy how science works! You can do some awesome stuff with it, if you know how.
")
Then how do you explain that the Penrose doesn't have 3D audio unlike the Mobius if they are using exactly the same drivers wired the same way ?3D emulation. Psycho-acoustics at play. They introduce delays in the other channel, phase shifts, etc.
Works also for binaural recordings played back over regular stereo headphones.
It's crazy how science works! You can do some awesome stuff with it, if you know how.
Also i tried binaural recordings on this headset still i can clearly ear that this is still fake surround.
It's a different product. The 3D is a software thing. You can use the same drivers, but if you do not implement the same electronics and software you do not have the same features.Then how do you explain that the Penrose doesn't have 3D audio unlike the Mobius if they are using exactly the same drivers ?
Also i tried binaural recordings on this headset still i can clearly ear that this is still fake surround.
Yes, binaural is not as good as a good implementation of 3D audio emulation apparently.
Actually, your comments are the best endorsement for this product possible. It's so good you can't even believe that it works how it works.
i don't know i tried some other headsets reconized as 7.1 and i could immediatly tell they were fake surround also some games have the ability to set audio as binaural and when i tried it it was nowhere near real surround.
If it was just delays and phase changes every games would use it because it could be simulated only on software side and don't require specific hardware.
Still the Mobius is the only headset i was able to precisely reconize sound directions.
I tried to set the Mobius to stereo and use the binaural implementation in the settings of the game and it sounded really fake only stereo. If binaural was as effective as you said i would not be able to hear the difference because when i'm using binaural i have no idea if enemies are in front or behind me.
If someone have a good 7.1 vs binaural test i want to try it because i tried severals and they all sounds like stereo to me.
Last edited:
i know exactly how does it works and still you are wrong. This headset does have true 8.1.
As i said i can ear the sound comes from front or behind and every directions.
It's a lot of us that are wrong I suppose, including the reviewer from Audioxpress and the manufacturer. Better get them straightened out right away!
If you read what I posted, they chose the way they thought best. Clearly, you believe they were successful, but you won't accept there is one driver?
i can't see in the manufacturer specifications that you have linked that there are only 1 transducter per earpiece...It's a lot of us that are wrong I suppose, including the reviewer from Audioxpress and the manufacturer. Better get them straightened out right away!
If you read what I posted, they chose the way they thought best. Clearly, you believe they were successful, but you won't accept there is one driver?
solderdude
Grand Contributor
From the official Audeze Mobius webpage FAQ:
and:
You are not going to believe us... I would suggest talking to Audeze and ask them if in Penrose and Mobius the same (single) driver is used.
Maybe that can convince you.
- Aren't Mobius and Penrose pretty much the same?
- Actually no. Other than having a common case and similar drivers and microphones, they use completely different chipsets, offer different connection methods and sampling rates, and connect to consoles differently. Both offer Bluetooth and analog connections for convenience, but these are not intended as primary use modes.
and:
- How exactly is Mobius different from Penrose?
- Mobius is primarily a wired USB headset which appears as an eight-channel (surround) output device to your computer; it features 3D audio and head-tracking technology which is not included in Penrose. Penrose is primarily a lossless, low-latency wireless two-channel (stereo) headset that uses a 2.4GHz USB transmitter.
- Mobius was designed mainly for PC use, while Penrose was designed with consoles in mind (but also works with PCs).
- If you're looking for a high resolution multimedia headset for PC, Mobius is the one for you!
You are not going to believe us... I would suggest talking to Audeze and ask them if in Penrose and Mobius the same (single) driver is used.
Maybe that can convince you.
- Does Mobius support Dolby Atmos, DTS-X, Windows Sonic, Tempest, etc for 3D audio rendering?
- Mobius does its own 3D processing, so it can be used for 5.1, 7.1 or stereo audio using speaker emulation technology and optional head-tracking. Mobius is also compatible with any pre-processed 3D audio such as those above, when used in Stereo or Hi-Res modes with 3D turned off.
Last edited:
Let's try it the other way, you claim that they have 4 drivers per side - can you provide proof of it? Disassembly pictures, technical specifications,..i can't see in the manufacturer specifications that you have linked that there are only 1 transducter per earpiece...
i can't see in the manufacturer specifications that you have linked that there are only 1 transducter per earpiece...
That was posted here:
Post in thread 'Master Complaint Thread About Headphone Measurements' https://audiosciencereview.com/foru...out-headphone-measurements.18451/post-1032460
You are really committed to being wrong it seems.
staticV3
Master Contributor
- Joined
- Aug 29, 2019
- Messages
- 7,854
- Likes
- 12,540
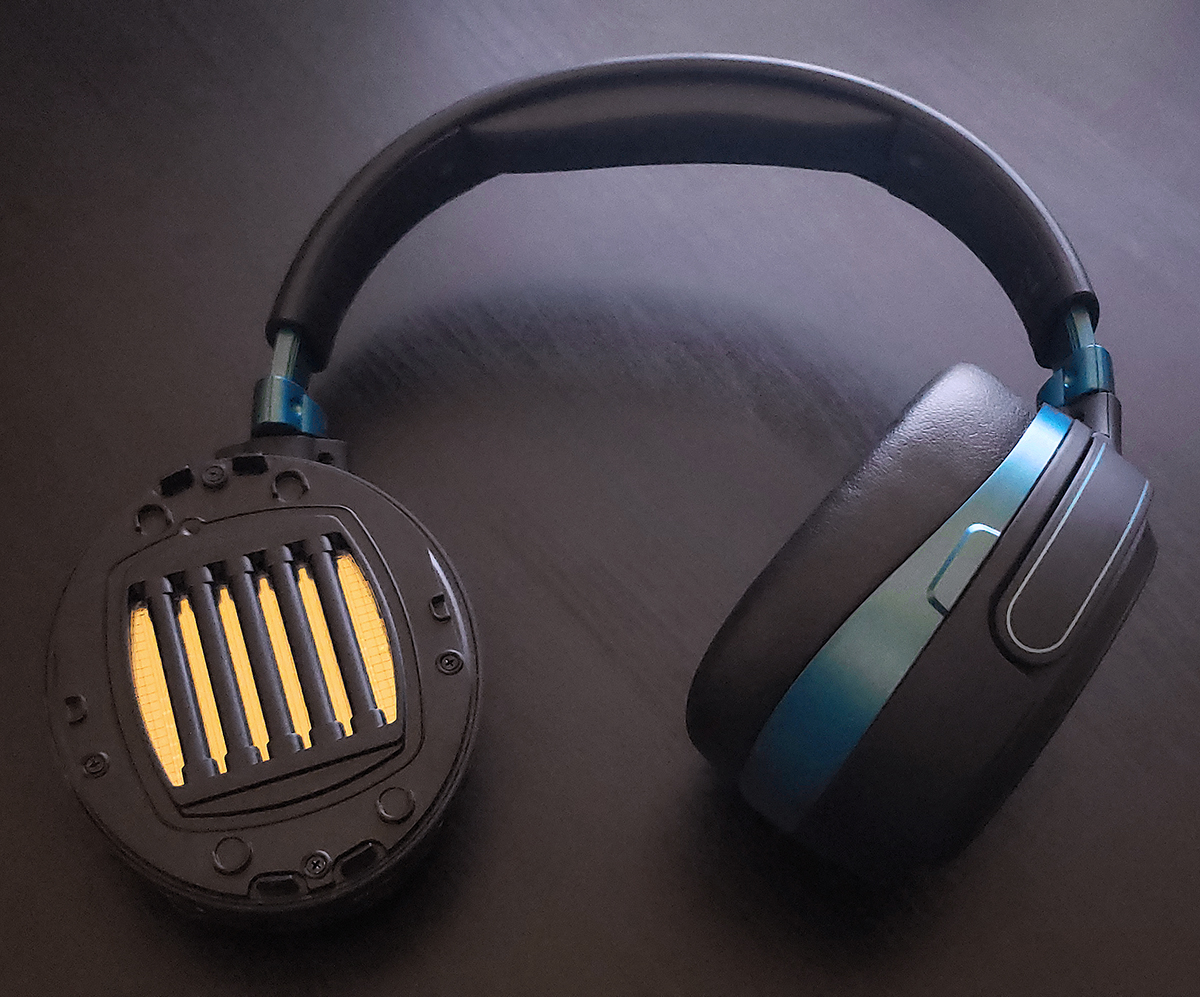
@Aresias here's a teardown of the Mobius, showing, among other things, the single large planar magnetic driver per side: https://fccid.io/2APRZ-MOBIUS/Internal-Photos/Internal-Photos-3871516#google_vignette
Edit: more pictures: https://www.head-fi.org/threads/audeze-mobius-review-impressions.887808/post-14779942
Edit: more pictures: https://www.head-fi.org/threads/audeze-mobius-review-impressions.887808/post-14779942
Hi Amirm!
Cay you give a time domain spectrum plot or measure the burst response of the headphones? It would be good to know about driver behaviour and how long lived the resonances are. It would be an important addition that tell a lot about the headphones. Thanks in advance.
Cay you give a time domain spectrum plot or measure the burst response of the headphones? It would be good to know about driver behaviour and how long lived the resonances are. It would be an important addition that tell a lot about the headphones. Thanks in advance.
xnor
Active Member
- Joined
- Jan 12, 2022
- Messages
- 193
- Likes
- 207
Spectrum means frequency domain, so mixing that with the term "time domain" doesn't work.time domain spectrum plot or measure the burst response
You can transform from one domain into the other and both contain the same information, though in audio FR plots we usually just plot the smoothed magnitude and omit the phase completely... because that is the easiest to understand and FR magnitude is the most important aspect in how a headphone sounds.
"Burst responses" (technically called impulse responses or IRs) are rarely measured directly because of SNR issues, because an impulse contains very little energy especially at low frequencies.
But that's not an issue, as I said you can transform from frequency response (measured e.g. with a sweep or noise) to time domain and plot the IR.
But you need to understand what you're looking at. In other words, interpreting IRs is where it gets tough...
and where we need to be careful. For example, a lot of people don't know that any deviation from flat in FR necessarily means "ringing" in the IR.It would be good to know about driver behaviour and how long lived the resonances are.
But this does not mean there is a resonance. Even an overdamped low-pass ("slow and smooth bass roll-off") results in "ringing".
Another thing is that this "ringing" usually is not audible as such. You don't hear the ringing at the cutoff frequency of the low-pass which you'd see in the IR, instead you hear the attenuation of lower frequencies, i.e. lack of sub-bass.
So I'd say that for most people such a visualization is not helpful. Even worse, I'd consider it harmful if people started to read magical audio properties out of IRs they don't understand.
Similar threads
- Replies
- 3
- Views
- 769
- Replies
- 73
- Views
- 4K
- Replies
- 55
- Views
- 6K
- Replies
- 3
- Views
- 636
- Replies
- 83
- Views
- 7K