• WANTED: Happy members who like to discuss audio and other topics related to our interest. Desire to learn and share knowledge of science required. There are many reviews of audio hardware and expert members to help answer your questions. Click here to have your audio equipment measured for free!

Just when you thought you understood vented speaker impedance!

Lao Lu

Active Member
Joined
Feb 6, 2020
Messages
109
Likes
123
Warning: For those who are less technical, while trying to keep it simple, some fairly advanced engineering concepts are involved here. Proceed at your own risk...

In my thread about Understanding Vented Speaker Impedance, I had used some definitions for the maxima and minima that came from the BassBox Pro manual. Here is a snippet from the online manual for reference:
index.php

As you can see the following are defined as follows:
  1. The first peak (maxima) is the resonance of the vents
  2. The minima (in the middle) is the system resonance of the box
  3. The second peak is the resonance of the driver in the box
One member challenged the first definition and, although I had considered this pretty staid material, started to research a bit more. Bassbox has been trusted for decades and is based on the work of Richard Small and his very established research done in the early 1970s. Having relied on Bassbox for years and found its modeling to be accurate, did not give these definitions much scrutiny. So, happened to have Small's AES papers and the main reference I found was in his Large Signal Analysis paper. In this paper he defines the first peak as fL, the minima as fM and the second peak as fH. Small also outlines a relationship between them based on fM being equal to fB and cites other research that establishes this holds as long as the voice coil inductance is low. For the Purifi woofer I am using this seems to apply and so then Small also states a mathematical relationship with them being:

fSB = (fL * fH) / fB where fSB is the resonance frequency for the driver for the air-load mass presented by the enclosure.

While this all seems straightforward, was left feeling it really did not help resolve the question over the Bassbox definition for the first peak (fL). Small's work includes some simplified electrical circuits analogs for a vented speaker. For brevity, I am not citing those here. Later, a more detailed model is supplied as you will see.

While have diverse engineering experience, am not an experienced electrical engineer and was unsure of whether I could get an answer from Bassbox creators after all these years, so started to search around the Internet for more detailed design vented speaker analysis and discovered the content was surprisingly inconsistent and weak. As you might expect, most of what I found was focused on the box resonance (fB) as it is the most fundamental parameter. As I had done, many were relying on one or more software packages to help with vented box design. So, I turned to my network for some expertise...

I sought some more contemporary help from the creator of VituixCAD (Kimmo Saunisto) and @Justin Zazzi who is working on his master degree in Acoustics and is on the Directiva r2 team. The initial part of this thread is a summary of the exchange between the member (@witwald) who challenged the Bassbox definition, Kimmo, Justin and I.

Normally would prefer to split this into a few posts, I have found that this can disrupt continuity, so apologize in advance for the long post. @witwald's original question was "Doesn't the impedance minimum between the two low-frequency impedance peaks correspond to the port tuning frequency? " My short response was yes, but later pointed out this seemed to be in conflict with the Bassbox definition for the first peak. I agreed, so made some attempts to define. fL was proposed, but I was looking something more meaningful than frequency Lower. He later found that the fL peak corresponded to back EMF from the woofer. While progress, I wanted to know what caused the back EMF?

Here is where I consulted Kimmo and he responded with the following model:

View attachment 224039

...(By the way) || is parallel connection, + is series connection

index.php


END OF Kimmo response

Later Kimmo supplied a VituixCAD project file for the model which is attached. I shared this with the group and will share my takeaways in my next post.

Expect that others in the group as well as the broader ASR membership will add to the thread discussion and hopefully drive towards a better understanding of vented speaker design.
Just a short, off topic question from someone who has been considering employing the services of someone such as yourself: Does this mean that sealed-box construction is easier to design and build? Thank you for you many interesting posts.
 

Justin Zazzi

Member
Joined
Sep 12, 2020
Messages
32
Likes
32
Location
Tempe, AZ
Analysis of dynamical systems is somewhat tricky. For a sinusoidal signal, the peak velocity occurs at the same frequency as the peak displacement, as velocity is the time derivative of the displacement signal. The two are displaced 90° in phase. For example, if the displacement is represented by a sine wave, x(t) = sin(ωt), then the velocity is represented by a cosine wave scaled by the circular frequency of the oscillation, v(t) = ω·cos(ωt).

The slight shift in the position of the 0° phase point is due to the damping in the system, which causes the impedance peak to be slightly higher in frequency. For the first peak, the phase is –8.5°, while for the second peak the phase is –9.2°.

From these results, it appears that Kimmo's model might be incorrect. It seems to change the phase relationship between the impedance peak and the 0° phase point. As it contradicts what I've seen Thiele, Small, and Benson use, I would treat it with caution before relying on it. Producing an impedance curve is one thing, but getting it to match the physical system is what we really need the model to do. I think that it's relatively easy to create a circuit that doesn't represent the physical system.

I like that the impedance maximum is not the same frequency as the phase zero crossing due to damping. This feels similar to Small's paper "Vented-Box Loudspeaker Systems Part II: Large-Signal Analysis" where in section 7 he describes how to measure the parameters of the system. Quote:

"However, if zero phase is not closely coincident with maximum of minimum magnitude, as may occur for moderate to high enclosure losses, the frequency of actual maximum or minimum impedance magnitude must be located as carefully as possible."

He follows up by suggesting when phase and impedance peaks to not align, the impedance peaks/valleys tend to align better with the system parameters than the phase zero-crossings would. This also matches your message earlier whereas I was looking for the zero-crossings. Nice!


(I guess the pictures I posted turned into gibberish...)
 
Last edited:

Justin Zazzi

Member
Joined
Sep 12, 2020
Messages
32
Likes
32
Location
Tempe, AZ
That's relatively easy to demonstrate.

The first impedance peak is at about 18.5 Hz, which is ω = 2*pi*18.5 = 116 radians/sec. At that frequency, the impedance of the inductor Lceb is Zlceb = j*Lceb*ω = j*56E-3*116 = j6.5 ohms. The impedance of the capacitor Cmep is Zcmep = 1/(j*116*180E-6) = -j47.9 ohms. Hence, it is apparent that in that arm of the circuit the impedance is dominated by the capacitor, and is j6.5-j47.9 = -j41.4. This is equivalent to a capacitor whose value is Cequiv = 1/(116*41.4) = 208 μF. This can then be added to Cmes because it is in parallel with it.

As a good first approximation, this can be simulated by simply short-circuiting Lceb in the equivalent circuit. In using this approach, we are relying on Zlceb being much smaller than Zcmep, which is true. This results in a single impedance peak at around 19.7 Hz, which is quite close to the 18.5 Hz peak in the original model. If we short-circuit Lceb (i.e., set it to zero) and change the value of Cmep to 208 μF, we get the resonance frequency of the impedance peak to drop to 18.5 Hz, just as it was in the original model.

I love it! Are you able to do a similar analysis to what happens near the second impedance peak at F_h ?
 

witwald

Senior Member
Forum Donor
Joined
Jul 23, 2019
Messages
479
Likes
504
Are you able to do a similar analysis to what happens near the second impedance peak at F_h ?
I'll give it a try...

The second impedance peak is at about 79 Hz, which is ω = 2*pi*79 = 496 radians/sec. At that frequency, the impedance of the inductor Lceb is Zlceb = j*Lceb*ω = j*56E-3*496 = j27.8 ohms. The impedance of the capacitor Cmep is Zcmep = 1/(j*496*180E-6) = -j11.2 ohms. Hence, it is apparent that in that arm of the circuit the impedance is dominated by the inductor, and is j27.8-j11.2 = j16.6. This is equivalent to an inductor whose value is Lequiv = 16.6/496 = 33.5 mH. This can then be added to Lces because it is in parallel with it.

As a good first approximation, this can be simulated by simply short-circuiting Cmep in the equivalent circuit. In using this approach, we are relying on Zcmep being much smaller than Zlceb, which is true. This results in a single impedance peak at around 62.9 Hz (see plot below), which is a bit below that of the original second 79 Hz peak in the original model. The reason for this is that the magnitude of the impedance from Lceb is only about 2.5 times that of Cmep at 79 Hz.
1662273203463.png

If we short-circuit Cmep (i.e., set it to infinity, representing infinite mass) and change the value of Lceb to 33.5 mH, we get the resonance frequency of the impedance peak to increase to 77.7 Hz, which is quite close to what it was in the original model.
1662273335578.png

The fact that we short-circuited Cmep, which translates to setting the mass of the air in the port to be infinite in value, means that the mass of air in the port is essentially not moving anymore. That is, the port is blocked, and the enclosure is behaving like a sealed enclosure at that frequency.

These equivalent circuits are pretty nifty, aren't they? :)
 
OP
Rick Sykora

Rick Sykora

Major Contributor
Forum Donor
Joined
Jan 14, 2020
Messages
3,613
Likes
7,344
Location
Stow, Ohio USA
Just a short, off topic question from someone who has been considering employing the services of someone such as yourself: Does this mean that sealed-box construction is easier to design and build? Thank you for you many interesting posts.

No question sealed is simpler. Simulation software has made vented design much more predictable. This thread started due to questioning root cause for one aspect of vented design in a established software package. Even if the developer misattributed the root cause, the models utilized are still valid.

Some of this is demonstrated on the Understanding Vented Speaker Impedance thread. If you are not technical, then stating what you want your speaker to do (in terms of size, cost, output and bass extension) will help determine whether sealed or vented is preferable.
 
OP
Rick Sykora

Rick Sykora

Major Contributor
Forum Donor
Joined
Jan 14, 2020
Messages
3,613
Likes
7,344
Location
Stow, Ohio USA
That's relatively easy to demonstrate.

The first impedance peak is at about 18.5 Hz, which is ω = 2*pi*18.5 = 116 radians/sec. At that frequency, the impedance of the inductor Lceb is Zlceb = j*Lceb*ω = j*56E-3*116 = j6.5 ohms. The impedance of the capacitor Cmep is Zcmep = 1/(j*116*180E-6) = -j47.9 ohms. Hence, it is apparent that in that arm of the circuit the impedance is dominated by the capacitor, and is j6.5-j47.9 = -j41.4. This is equivalent to a capacitor whose value is Cequiv = 1/(116*41.4) = 208 μF. This can then be added to Cmes because it is in parallel with it.

As a good first approximation, this can be simulated by simply short-circuiting Lceb in the equivalent circuit. In using this approach, we are relying on Zlceb being much smaller than Zcmep, which is true. This results in a single impedance peak at around 19.7 Hz, which is quite close to the 18.5 Hz peak in the original model. If we short-circuit Lceb (i.e., set it to zero) and change the value of Cmep to 208 μF, we get the resonance frequency of the impedance peak to drop to 18.5 Hz, just as it was in the original model.

Thanks, this is helpful and I understand. At the fL frequency, this explains it well.

As I mentioned in post #2, I see the Bassbox perspective too (at more of an application level). If you take the model and incrementally increase the port mass, it is hard to deny the port's influence on the first peak. So, for the purpose of relating to the vented system, I suggest it is still useful. After all, it is the part of the model that most represents the port's role.
 

Lao Lu

Active Member
Joined
Feb 6, 2020
Messages
109
Likes
123
No question sealed is simpler. Simulation software has made vented design much more predictable. This thread started due to questioning root cause for one aspect of vented design in a established software package. Even if the developer misattributed the root cause, the models utilized are still valid.

Some of this is demonstrated on the Understanding Vented Speaker Impedance thread. If you are not technical, then stating what you want your speaker to do (in terms of size, cost, output and bass extension) will help determine whether sealed or vented is preferable.
Thanks a lot!
 

abdo123

Master Contributor
Forum Donor
Joined
Nov 15, 2020
Messages
7,446
Likes
7,955
Location
Brussels, Belgium
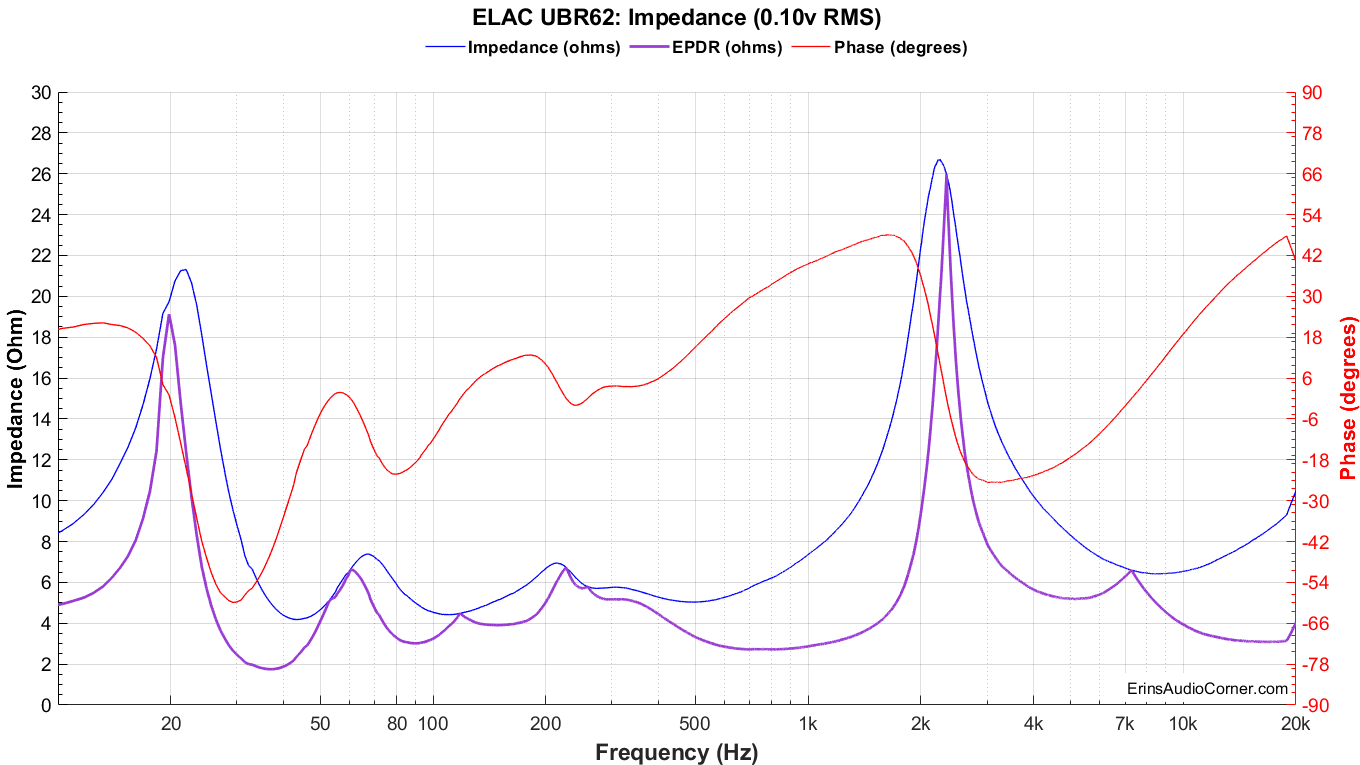
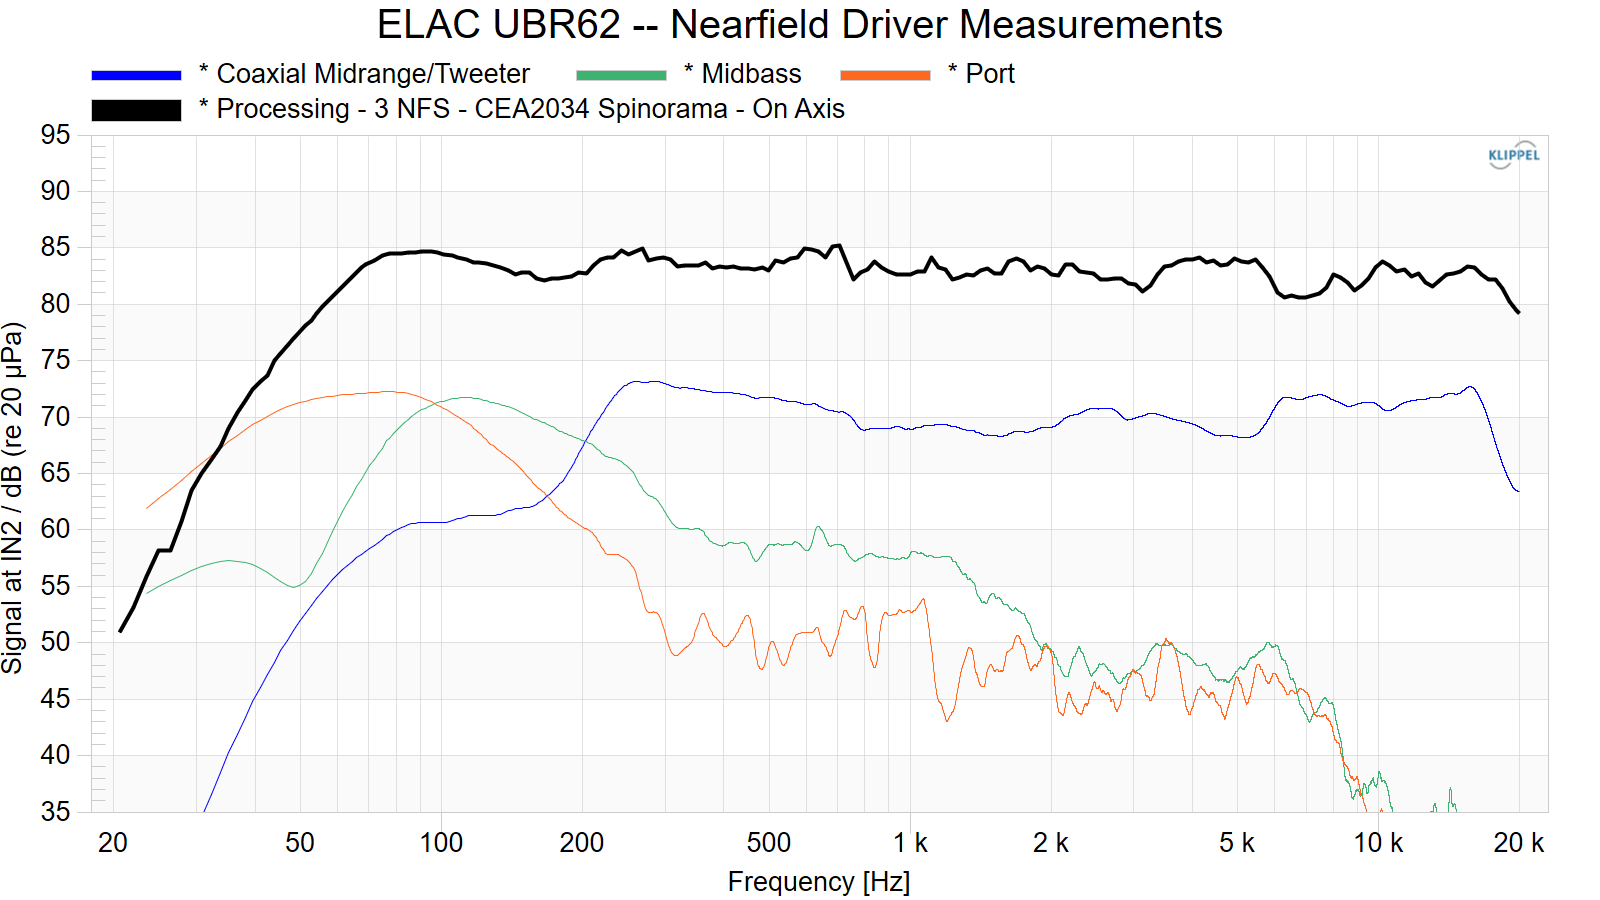
Can someone explain why the ELAC UBR62 doesn't show the typical two peaks in its impedance plot?

ELAC%20UBR62_Impedance_0.1v.png

ELAC%20UBR62%20--%20Nearfield%20Driver%20Measurements.png
 
OP
Rick Sykora

Rick Sykora

Major Contributor
Forum Donor
Joined
Jan 14, 2020
Messages
3,613
Likes
7,344
Location
Stow, Ohio USA
Can someone explain why the ELAC UBR62 doesn't show the typical two peaks in its impedance plot?

ELAC%20UBR62_Impedance_0.1v.png

ELAC%20UBR62%20--%20Nearfield%20Driver%20Measurements.png

This question is probably better in the other thread as it shows comparable alignments. Without a baseline from Elac, this is more speculative, but looks as though the speaker is tuned towards giving it a bass boost. The nearfields support this as you can see significant port output around 100Hz.
 
Last edited:

Spkrdctr

Major Contributor
Joined
Apr 22, 2021
Messages
2,223
Likes
2,944
So this thread explains why many speaker designers are heavy drinkers! :)
 
OP
Rick Sykora

Rick Sykora

Major Contributor
Forum Donor
Joined
Jan 14, 2020
Messages
3,613
Likes
7,344
Location
Stow, Ohio USA
Which thread?
 
OP
Rick Sykora

Rick Sykora

Major Contributor
Forum Donor
Joined
Jan 14, 2020
Messages
3,613
Likes
7,344
Location
Stow, Ohio USA
> So you thought you understood vented speaker impedance?

What? When did that happen? How drunk was I?

It was more likely me and think am going to need a stiff drink or two before this thread concludes! :)
 

AdamG

Helping stretch the audiophile budget…
Moderator
Forum Donor
Joined
Jan 3, 2021
Messages
4,742
Likes
15,699
Location
Reality
It was more likely me and think am going to need a stiff drink or two before this thread concludes! :)
Thread cleaned up as requested. Let me know if you have any more issues Rick. Enjoy your Sunday night buddy.
 
  • Like
Reactions: MAB
Top Bottom