Personally I am disappointed the correction must be being applied to "solve" resonances in this model.
The magnitude of any resonance will depend on for how long it is excited and damping, so making a correction which is adequate for a flat frequency response under steady state or a certain sweep speed does not convince, me at least, it would be always correct on music.
Oh man.
Well by that logic, then what is the point of looking at any typical frequency response graph for any speaker at all?
What is the point of reading Toole's book or the numerous sources of information presented by extremely talented people.
What is the point of all of the PEQ/DSP filters used by thousand of people and many top quality designs(and certainly every active design).
Yes they all probably behave in some unpredicted ways when playing actual content but there are always resonances corrected for in the design in various ways and at various stages.
Have you designed a few speakers?
Every speaker has problems that have been 'solved', that is what designing is.
Beyond that it is 2023. Why on Earth would anyone not use DSP in a design when possible? The way I see it, that is like saying I am really disappointed that my car requires electronically controlled fuel injection when perfecting the carburetor would be preferred to me.
Measurements are for a purpose. That "accepted" method is for generating a the FR of the full speaker using near-field measurements. When there is a proper Klippel measurement why would anyone needs to "closely approximate" a FR? Yes, it "could" be done but it is not done here because the close-field measurement's only purpose is to show each driver's response, not the speaker's overall response.
I am not talking about summing the drivers overall response, as yes the Klippel NFS has done that well. But that method will allow you to understand the ports SPL relative to drivers when given a particular input level.
I was discussing more correctly over-laying them as a way to make the chart more technically correct for the average person who looks at it.
So the ports actual output level is laying on top of the woofers actual output level, generally that needs to be calculated and is different for different speakers and can't be eyeballed.
This would be for some a minor thing but in the context of the conversation being carried on here it was pointed out that this is something to consider if someone is really going examine this particular chart.
Personally I don't care much either way but I understand what I am looking at in the ASR nearfield chart and it's limitations as source of information.
But the real question is what are the needed power and Max Spl?
And of course who needs such db monster factories for home listenning...
I don't! Well under 96 headroom included!
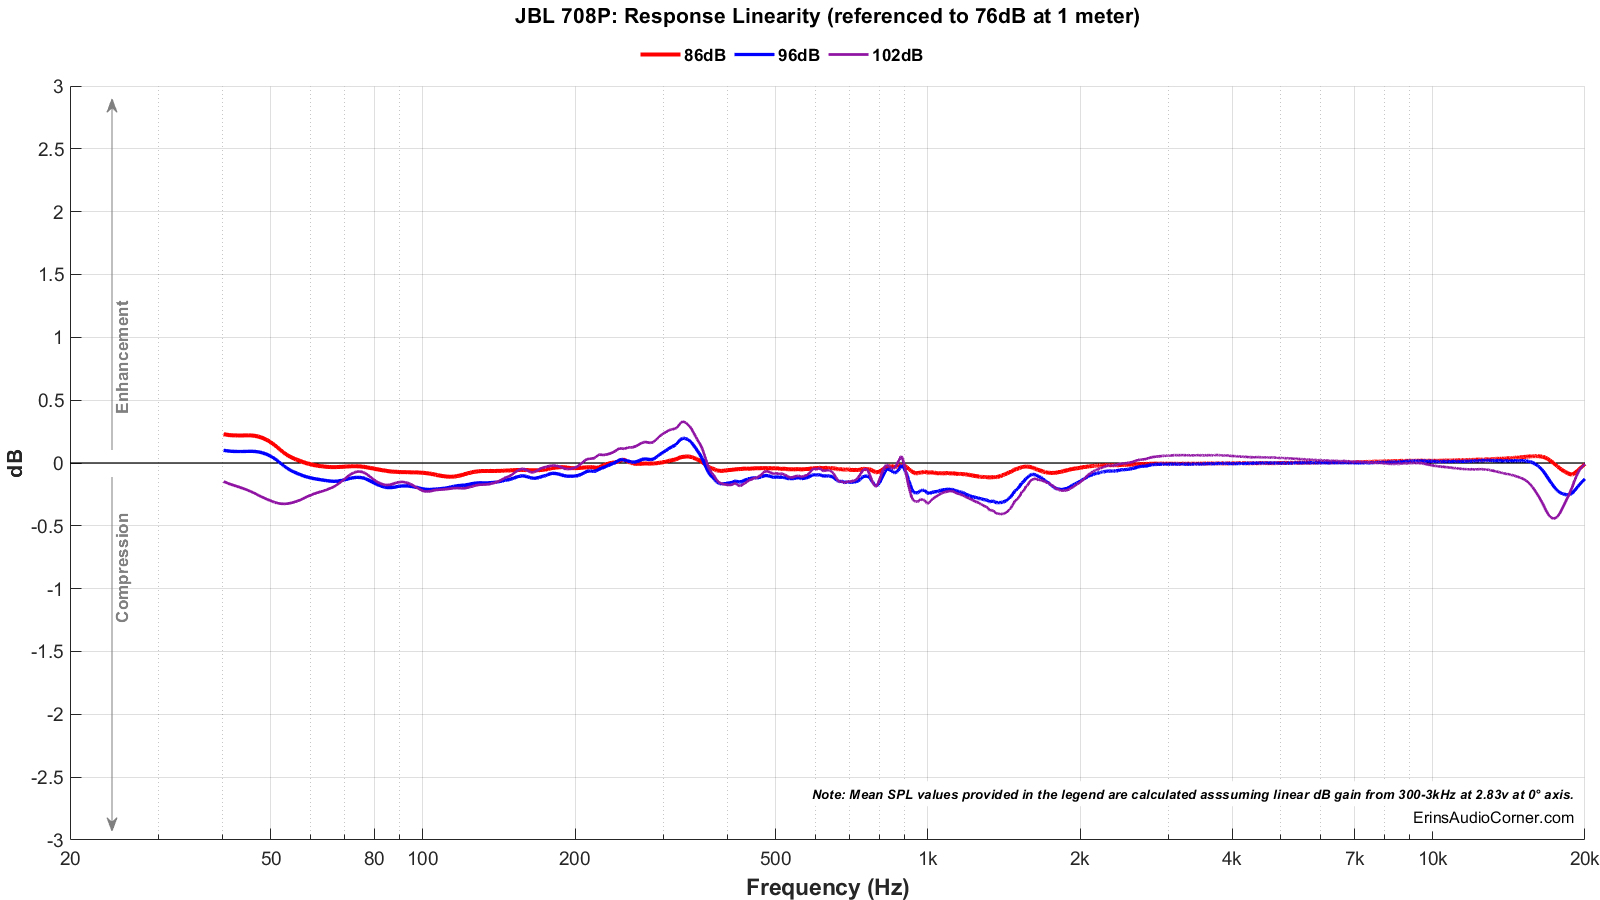
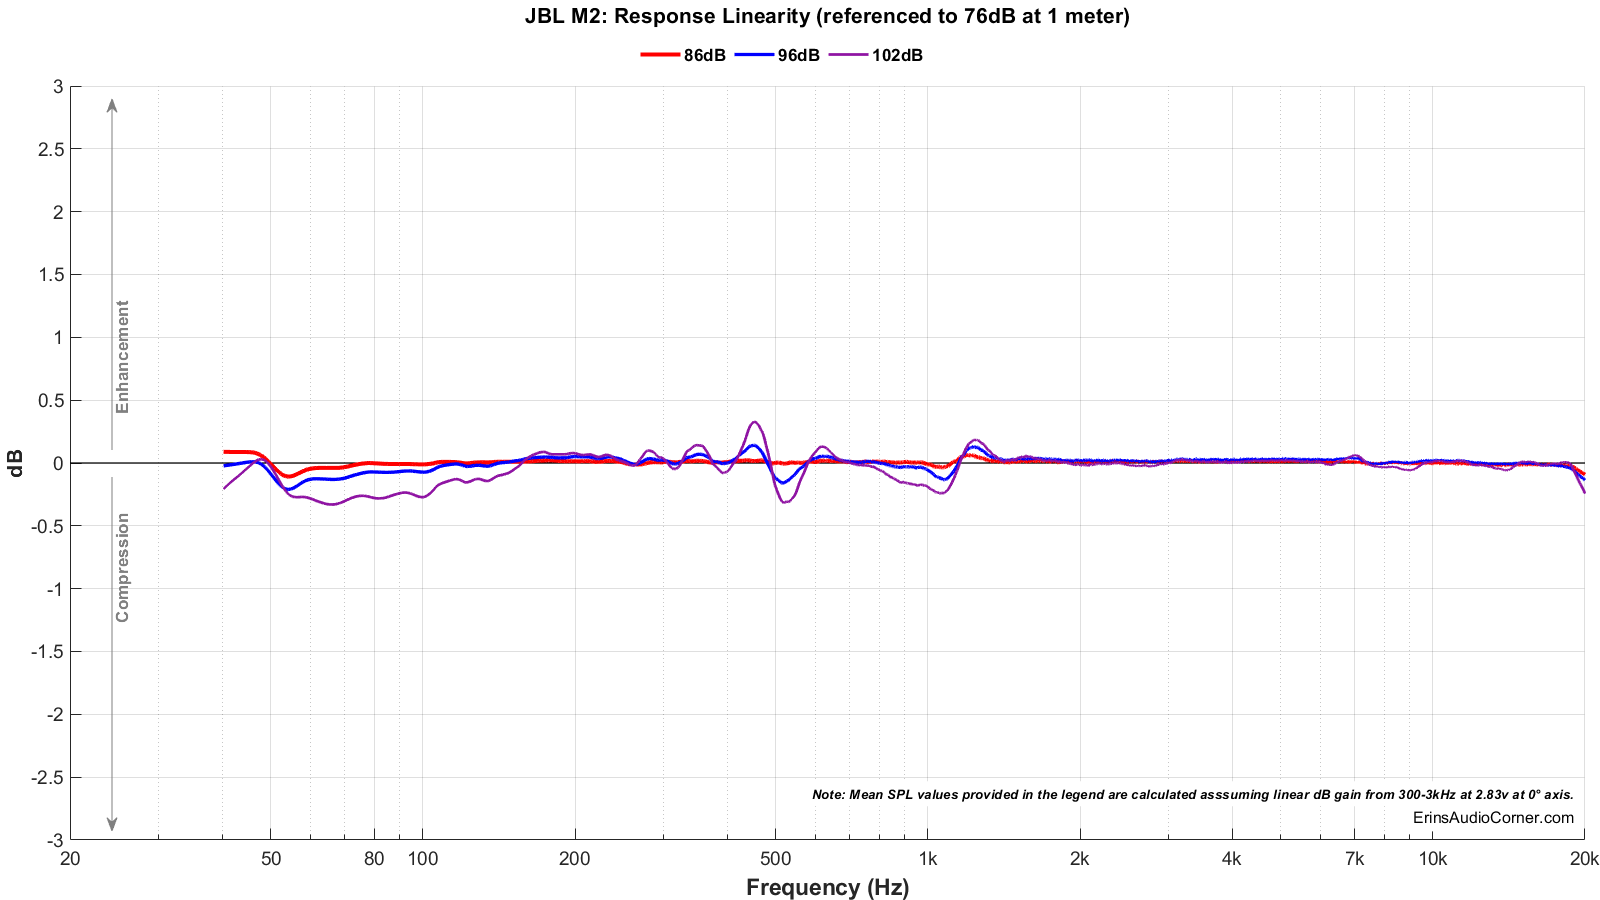
That 708p in that chart is an active speaker, who cares about power requirements here as the driver is not measurably stressed yet and the internal amp is doing its thing and providing enough power to cleanly sweep 102db@meter.
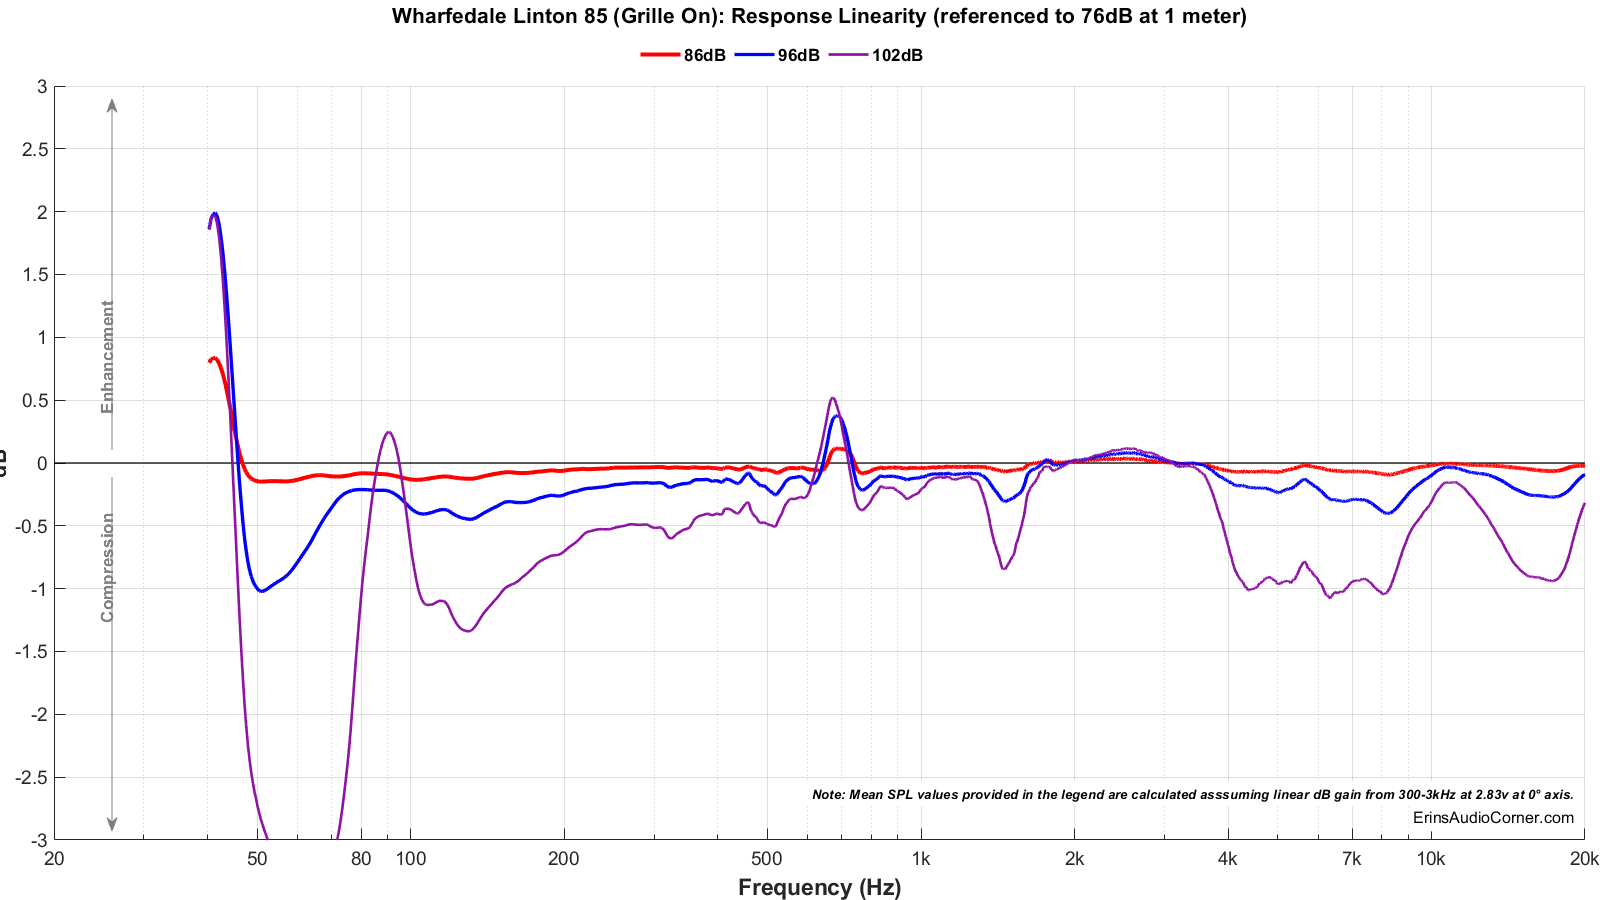
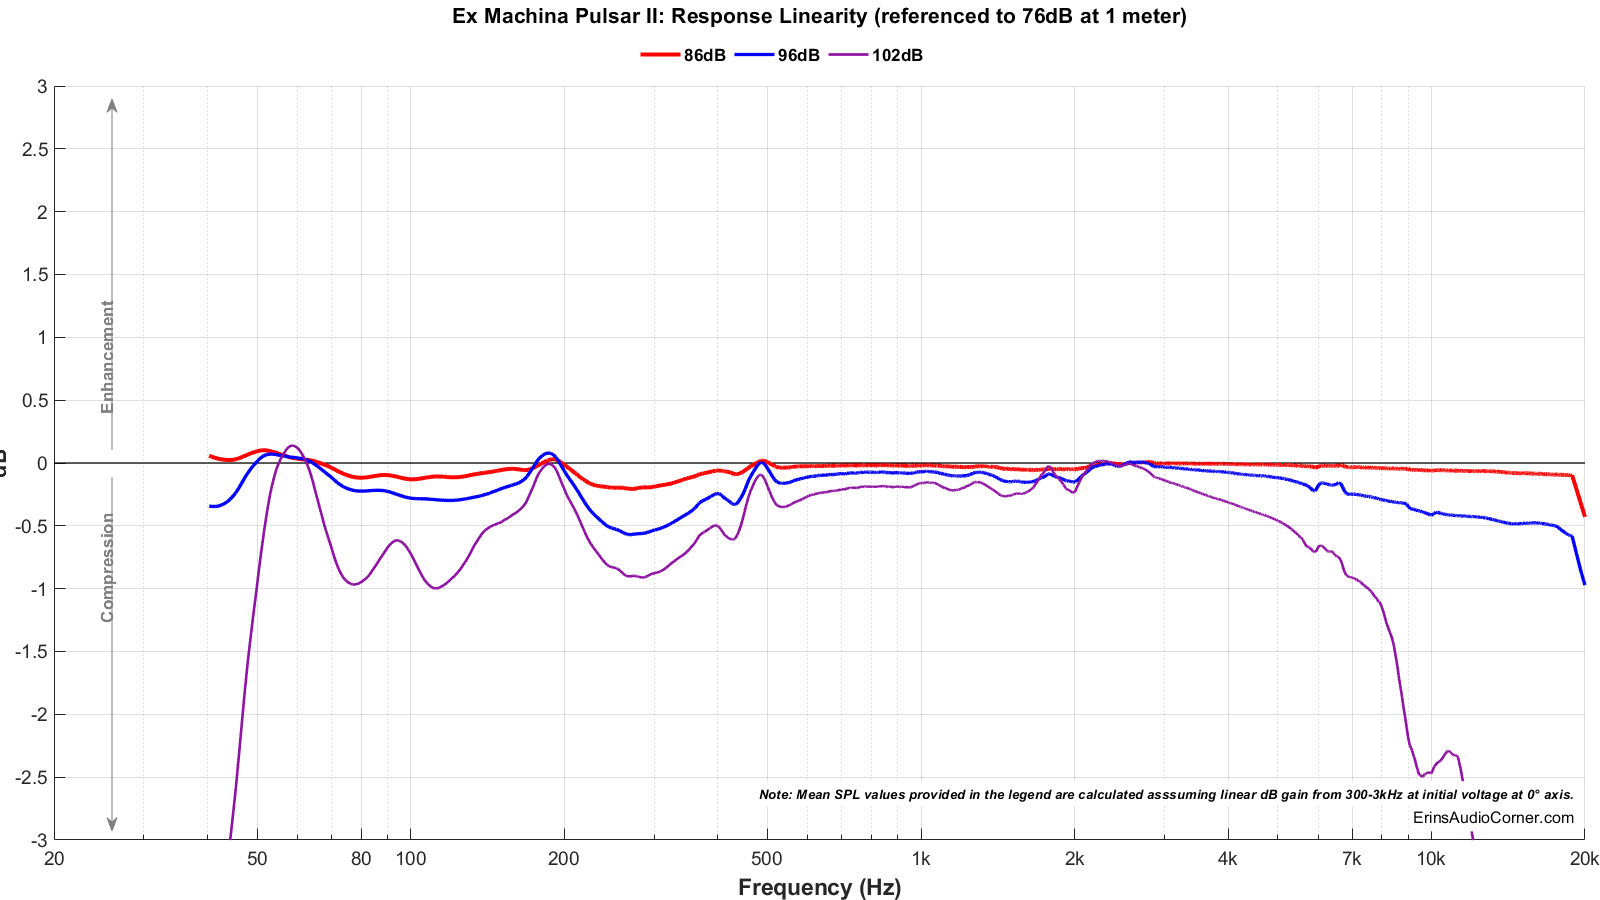
What we(at least I'd) need to see is if this speaker can handle 106db@1m maybe even 110db@1m. That would be helpful to know.
I don't know about you but I am not 1meter away from my speakers. @12feet/3.7meters away 102db@1meter is now approx [email protected].
Add the 2nd driver in for stereo and we do have fairly loud @
[email protected] but I exceed this regularly with loud passages when doing a louder session.
If you don't value the output levels above, and/or sit in the nearfield then you can pass on these and many other speakers. You will be fine with a small speaker with modest output ability.
The distance attenuation calculator finds how the sound level in dB decreases with distance from the sound source.

www.omnicalculator.com


 audiojudgement.com


