• WANTED: Happy members who like to discuss audio and other topics related to our interest. Desire to learn and share knowledge of science required. There are many reviews of audio hardware and expert members to help answer your questions. Click here to have your audio equipment measured for free!

Is the Klippel NFS capable of true 3d directivity measurements?

kenshone

Active Member
Joined
May 15, 2022
Messages
198
Likes
103
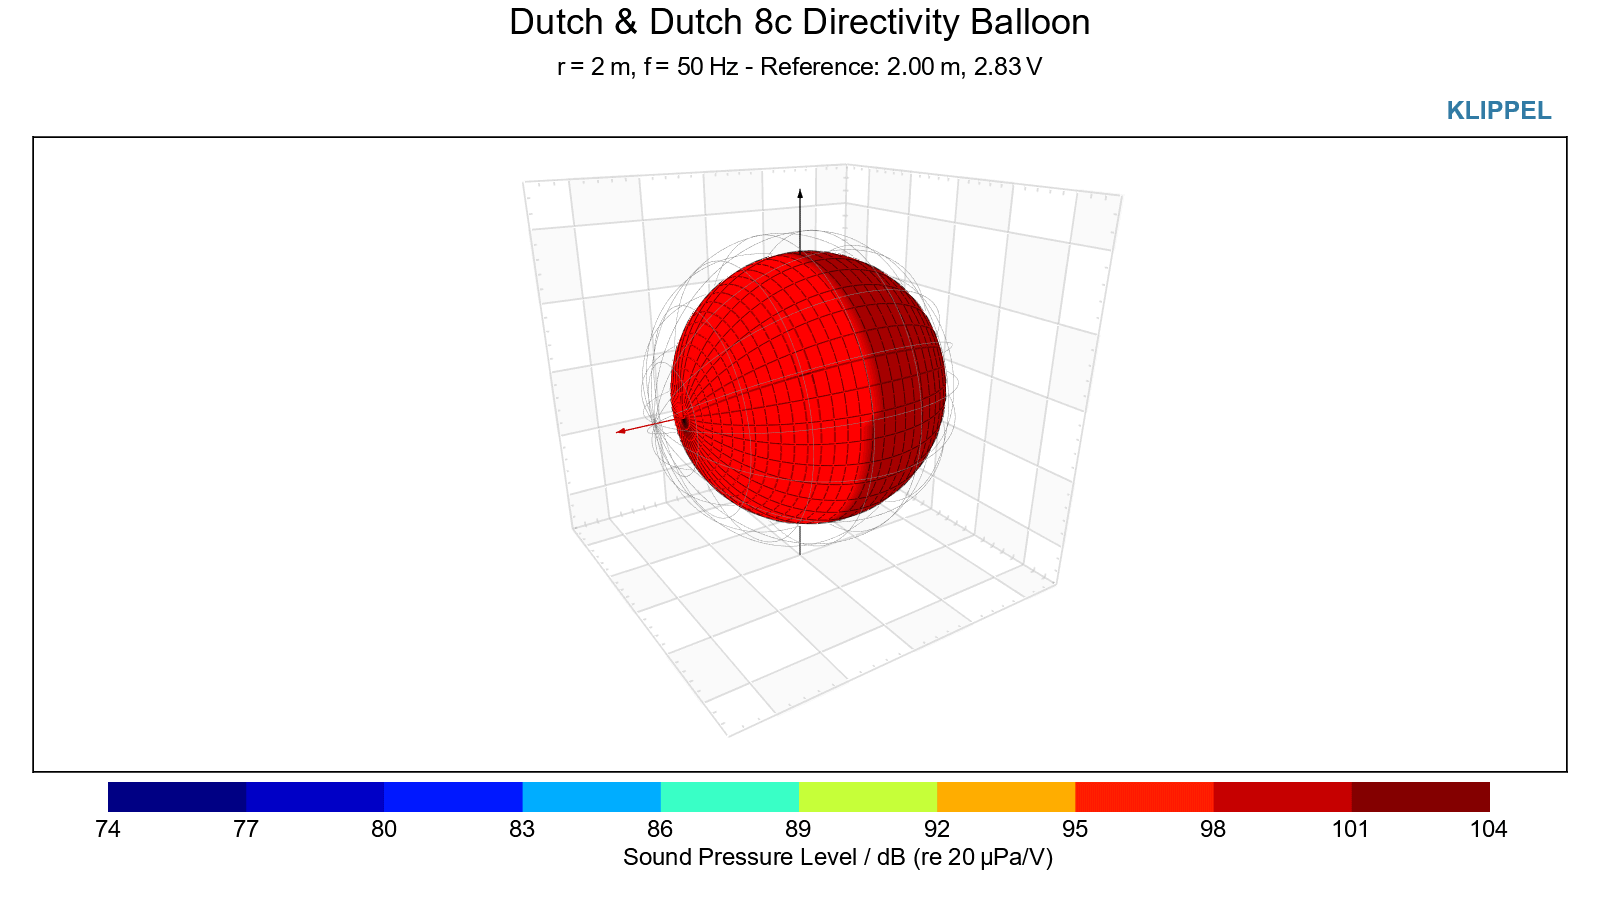
Sorry if I'm missing something obvious here, but the Klippel NFS measurements I've seen only represent 2d circles in 3d space -- for example, with a fixed horizontal offset of 0 degrees, or a fixed vertical offset of 0 degrees.

Is the Klippel NFS capable of recording a full 3d sphere of directivity measurements around a speaker?
 

AwesomeSauce2015

Active Member
Joined
Apr 14, 2022
Messages
204
Likes
195
IIRC, Some of Amir's reviews have a 3d plot which shows the radiation of the speaker at a specific frequency.
See Genelec 8361a review: https://www.audiosciencereview.com/...s/genelec-8361a-review-powered-monitor.28039/
Is the "Directivity Balloon" measurement what you are looking for?

I mean, the Klippel NFS (from what I understand) records the frequency response at a cloud of points around the speaker, and then it can produce the results we see. It should be able to produce 3d plots of the radiation pattern, from that data, but I don't know how you would depict that type of plot in a graphical sense.

I'm assuming you want a plot that combines intensity, horizontal and vertical angle, and frequency all in one. I don't know how you would map all that to a 3d image while displaying it on a 2d monitor...
 

MZKM

Major Contributor
Forum Donor
Joined
Dec 1, 2018
Messages
4,250
Likes
11,551
Location
Land O’ Lakes, FL
IIRC, Some of Amir's reviews have a 3d plot which shows the radiation of the speaker at a specific frequency.
See Genelec 8361a review: https://www.audiosciencereview.com/...s/genelec-8361a-review-powered-monitor.28039/
Is the "Directivity Balloon" measurement what you are looking for?

I mean, the Klippel NFS (from what I understand) records the frequency response at a cloud of points around the speaker, and then it can produce the results we see. It should be able to produce 3d plots of the radiation pattern, from that data, but I don't know how you would depict that type of plot in a graphical sense.

I'm assuming you want a plot that combines intensity, horizontal and vertical angle, and frequency all in one. I don't know how you would map all that to a 3d image while displaying it on a 2d monitor...
The Maggie LRS also had some cool visuals:
 

KSTR

Major Contributor
Joined
Sep 6, 2018
Messages
2,738
Likes
6,112
Location
Berlin, Germany
Is the Klippel NFS capable of recording a full 3d sphere of directivity measurements around a speaker?
Yes. From what I understand they do this by using two scan runs, spherically around the speaker, with different distances (radii) and a lot of sophisticated math to extract the pressure gradients coming from the center of the spheres and generate the equivalent far-field 3D sound pressure data which is what we look at as the final result.

There is an error constraint in that the speaker overall size shall be smaller than the inner sphere of measured points and the assumed center point must be correctly aligned to the speaker's nominal or practical acoustic axis origin, focussing on the mid/high frequencies. Obviously, the smaller of the measurement spheres can't be any smaller than completely surrounding the speaker but I don't know (I did not read up, that is) how large the inner spere's radius should be vs speaker size for reliable results. Same goes for how small the room around the whole arrangement could get without resolution/noise error problems, as well as the minimum radius spacing between the two runs.
 
Last edited:

abdo123

Master Contributor
Forum Donor
Joined
Nov 15, 2020
Messages
7,444
Likes
7,954
Location
Brussels, Belgium
I still remember @hardisj 's first Klippel review where he made this awesome animation for the D&D 8C

Directivity-Balloon.gif
 
OP
K

kenshone

Active Member
Joined
May 15, 2022
Messages
198
Likes
103
If the raw SPL data for each point in space was made available, there's probably some Javascript library that would let you interactively visualize it in a browser. For example, you might be able to grab the sphere and spin it. In the case of the animation linked above, there might be a slider to see the sphere at different frequencies.
 

AwesomeSauce2015

Active Member
Joined
Apr 14, 2022
Messages
204
Likes
195
If the raw SPL data for each point in space was made available, there's probably some Javascript library that would let you interactively visualize it in a browser. For example, you might be able to grab the sphere and spin it. In the case of the animation linked above, there might be a slider to see the sphere at different frequencies.

That would be cool. It shouldn't be too hard to implement these days, but one problem I foresee with that would be mobile integration. Figuring out mobile device controls for such an object wouldn't be trivial.

The NFS seems to be capable of generating the required data to produce such a "directivity balloon", it would just be a matter of someone taking a 3d renderer and doing it...

Also: I downloaded and looked at the data posted in the Genelec 8361A review. It seems as though the data published is only 2 slices. We have a horizontal slice with vertical being 0, and a vertical slice at 0 horizontal. That data is also only in 10 degree increments and is already over 100KB per slice / file. We would need 36 (or something like that) individual vertical or horizontal "slices" in order to properly render a balloon graphic, and that's only for 10deg increments. Realistically, we would probably want more angular resolution to really see what the speaker is doing, and could probably get away with only a few frequencies. We would still have a lot of data to host / process though...

Conclusion: I don't think implementing something like this is really worth it considering the development and hosting / upkeep cost. It wouldn't really add too much value to the average speaker review since the reviewer can produce those graphics if the speaker needs them (ie: weird port cancellation, or something else), and if the speaker doesn't need it then the traditional directivity graphics are probably "good enough".

What would be really cool, however, is if we could take the Klippel data and input it into some kind of room simulator, where we can see exactly how the speaker will behave in a given room (room drawn in CAD obviously). However, this would probably take a TON of dev effort and would require quite a bit of computer horsepower to run for any reasonable accuracy...
 
OP
K

kenshone

Active Member
Joined
May 15, 2022
Messages
198
Likes
103
You could extend such an idea -- a simulator that takes the Klippel data for a set of speakers that someone intends to use in a HT setup for example, a way to specify the reflective surfaces, speaker positions, speaker amplification, and listening positions, and then a calculation of the expected frequency response at each listening position.

This could be converted into an optimizer that would suggest speaker positions, listening positions, and/or amplification power.

I don't know how such a simulator could be simplified for use by the average non-technical person, unfortunately, but I'm part of the niche that would play around with such a tool.
 

abdo123

Master Contributor
Forum Donor
Joined
Nov 15, 2020
Messages
7,444
Likes
7,954
Location
Brussels, Belgium
You could extend such an idea -- a simulator that takes the Klippel data for a set of speakers that someone intends to use in a HT setup for example, a way to specify the reflective surfaces, speaker positions, speaker amplification, and listening positions, and then a calculation of the expected frequency response at each listening position.

This could be converted into an optimizer that would suggest speaker positions, listening positions, and/or amplification power.

I don't know how such a simulator could be simplified for use by the average non-technical person, unfortunately, but I'm part of the niche that would play around with such a tool.
I think you can do this with hardware capable Ray tracing modern GPUs, but sound isn’t really specular at low frequencies like light is so it’s going to be quite complex.
 

Axo1989

Major Contributor
Joined
Jan 9, 2022
Messages
2,880
Likes
2,917
Location
Sydney
I still remember @hardisj 's first Klippel review where he made this awesome animation for the D&D 8C

Directivity-Balloon.gif

Yes this is a great visualisation. I'd like to grab the corner and rotate it of course. :)

I think I've also seen the odd ASR review with something similar? Presumably this is significant extra work or it would be standard. Theoretically at least the routine/s could be scripted to generate more-or-less automatically. I would love to see it as part of the test result suite (while I'm writing a wish list).
 

Axo1989

Major Contributor
Joined
Jan 9, 2022
Messages
2,880
Likes
2,917
Location
Sydney
... What would be really cool, however, is if we could take the Klippel data and input it into some kind of room simulator, where we can see exactly how the speaker will behave in a given room (room drawn in CAD obviously). However, this would probably take a TON of dev effort and would require quite a bit of computer horsepower to run for any reasonable accuracy.

I used SketchUp for a while (for 3D drawing) at least until a while back when it became a web app/subscription thing. There was a plug-in that looked promising for room acoustics but It disappeared before I could get my hands on it. The idea I think was that you could set the acoustic behaviour of surfaces and objects in the normal ways and get some thing like a more sophisticated REW room simulation.

Your idea of dropping in Klippel-like data to represent the sound sources is great. The combination would be brilliant.

As @abdo123 said, ray-tracing (above Shroeder) is straightforward game engine stuff, but low frequency pressure wave behaviour would require different maths. I'm sure that exists. The market incentive to put it all together in a usable package isn't there I imagine. As a limited market professional package the cost would be high, naturally.
 

Axo1989

Major Contributor
Joined
Jan 9, 2022
Messages
2,880
Likes
2,917
Location
Sydney
A question that's been in the back of my mind re Klippel NFS: how are the reflections calculated?

Presumably there is a model of the room from which those front/back/side/floor/ceiling curves are derived. Along with room size, listening distance and reflectivity assumptions or similar. Is any of it specified/configurable? Does anyone know more detail?
 
Last edited:

617

Major Contributor
Forum Donor
Joined
Mar 18, 2019
Messages
2,433
Likes
5,377
Location
Somerville, MA
You could extend such an idea -- a simulator that takes the Klippel data for a set of speakers that someone intends to use in a HT setup for example, a way to specify the reflective surfaces, speaker positions, speaker amplification, and listening positions, and then a calculation of the expected frequency response at each listening position.

This could be converted into an optimizer that would suggest speaker positions, listening positions, and/or amplification power.

I don't know how such a simulator could be simplified for use by the average non-technical person, unfortunately, but I'm part of the niche that would play around with such a tool.
In my opinion the difficulty with such a visualization is not necessarily the data processing and display but conceiving of a visualization which portrays loudspeaker radiation in a way which tells you something about how the speaker sounds. Ironically, and it took me a long time to come around to this as a speaker designer, the spinorama graph and other simple graphs presented by Amir really do tell you a lot about a speaker - especially the DI curve.

I do like the bubble visualizations though.
 

Axo1989

Major Contributor
Joined
Jan 9, 2022
Messages
2,880
Likes
2,917
Location
Sydney
In my opinion the difficulty with such a visualization is not necessarily the data processing and display but conceiving of a visualization which portrays loudspeaker radiation in a way which tells you something about how the speaker sounds. Ironically, and it took me a long time to come around to this as a speaker designer, the spinorama graph and other simple graphs presented by Amir really do tell you a lot about a speaker - especially the DI curve.

I do like the bubble visualizations though.

Yes, it's quite hard to interpret 3-dimensional data for many people, then add both frequency and time for five dimensions.

The bubble visualisation is great. Add two (for stereo) and run it in a room and things get pretty fancy.

That said, I'd certainly like a bubble and a wavelet included in speaker results. No pressure.
 

amirm

Founder/Admin
Staff Member
CFO (Chief Fun Officer)
Joined
Feb 13, 2016
Messages
44,602
Likes
239,834
Location
Seattle Area
A question that's been in the back of my mind re Klippel NFS: how are the reflections calculated?

Presumably there is a model of the room from which those front/back/side/floor/ceiling curves are derived. Along with room size, listening distance and reflectivity assumptions or similar. Is any of it specified/configurable? Does anyone know more detail?
This is not a function of Klippel. CEA 2034 defines which angles are to be combined and with what algorithm to arrive at the reflection graph. This was based on work by Alen Devantier while at Harman. He surveyed a number of rooms and arrived and at the recommended strong reflections. Klippel software simply extracts these angles (out of the full 360 degrees which it has measured/computed) and plots them as a post process.
 

Axo1989

Major Contributor
Joined
Jan 9, 2022
Messages
2,880
Likes
2,917
Location
Sydney
This is not a function of Klippel. CEA 2034 defines which angles are to be combined and with what algorithm to arrive at the reflection graph. This was based on work by Alen Devantier while at Harman. He surveyed a number of rooms and arrived and at the recommended strong reflections. Klippel software simply extracts these angles (out of the full 360 degrees which it has measured/computed) and plots them as a post process.

Thank you. I expect that work is interesting. Is there a particular published reference you think is worth reading? From Devantier possibly. I imagine the CEA spec is dry (and if it's like ISO, expensive)?
 

restorer-john

Grand Contributor
Joined
Mar 1, 2018
Messages
12,680
Likes
38,784
Location
Gold Coast, Queensland, Australia
I wish it was like this, but we'd need a supercomputer someplace...


1660183223024.png


You could switch on and off whatever layers/data you want and zoom in/out rotate etc.
 

amirm

Founder/Admin
Staff Member
CFO (Chief Fun Officer)
Joined
Feb 13, 2016
Messages
44,602
Likes
239,834
Location
Seattle Area
Thank you. I expect that work is interesting. Is there a particular published reference you think is worth reading? From Devantier possibly. I imagine the CEA spec is dry (and if it's like ISO, expensive)?
Yes:

Characterizing the Amplitude Response of
Loudspeaker Systems
Allan Devantier
Harman International Industries Inc., Northridge, CA, 91329, USA

ABSTRACT
The amplitude response of a loudspeaker system is characterized by a series of spatially averaged
measurements. The proposed approach recognizes that the listener hears three acoustical events in a typical
domestic environment: the direct sound, the early arrivals and the reverberant sound field. A survey of 15
domestic multi-channel installations was used to determine the typical angle of the direct sound and the early
arrivals. The reflected sound that arrives at the listener after encountering only one room boundary is used to
approximate the early arrivals, and the total sound power is used to approximate the reverberant sound field.
Two unique directivity indices are also defined and the in-room response of the loudspeaker is predicted from
anechoic data.
 
Top Bottom