• WANTED: Happy members who like to discuss audio and other topics related to our interest. Desire to learn and share knowledge of science required. There are many reviews of audio hardware and expert members to help answer your questions. Click here to have your audio equipment measured for free!

Is DAC ultrasonic/RF output important?

pkane

Master Contributor
Forum Donor
Joined
Aug 18, 2017
Messages
5,677
Likes
10,311
Location
North-East
This is a question and an on-going investigation. I don't have the answers although intend to spend some time looking into it. Would appreciate any thoughts, suggestions on how to test, or pointers to other existing research or test results.

HQPlayer author Jussi (@Miska ) has been advocating measurements of DACs well beyond the audible range, into many MHz. He shared some not-so-good looking plots of various DACs producing high level distortion, much past the 24kHz range. The contention is that such noise and spurious signals could inter-modulate into the audible range producing distortion there. What's more, such intermodulation can occur outside the DAC, for example in the preamp, or the amp, if these are not appropriately filtered at the input.

With my distortion simulation tool, DISTORT, I was able to confirm that aliasing and IMD from high-frequency noise/signal could be reflected below 24kHz. Here's a simple 2-tone (SMTPE 60Hz/7kHz) IMD test with two RF-frequency tones added in the presence of some minor non-linear distortion. The two spurious tones are at 1MHz @ -50dB and 10MHz @ -60dB. Red components are caused by the RF signal:

image.png.89bd5bd2ffe5616fa66358c9a60dfb3d.png


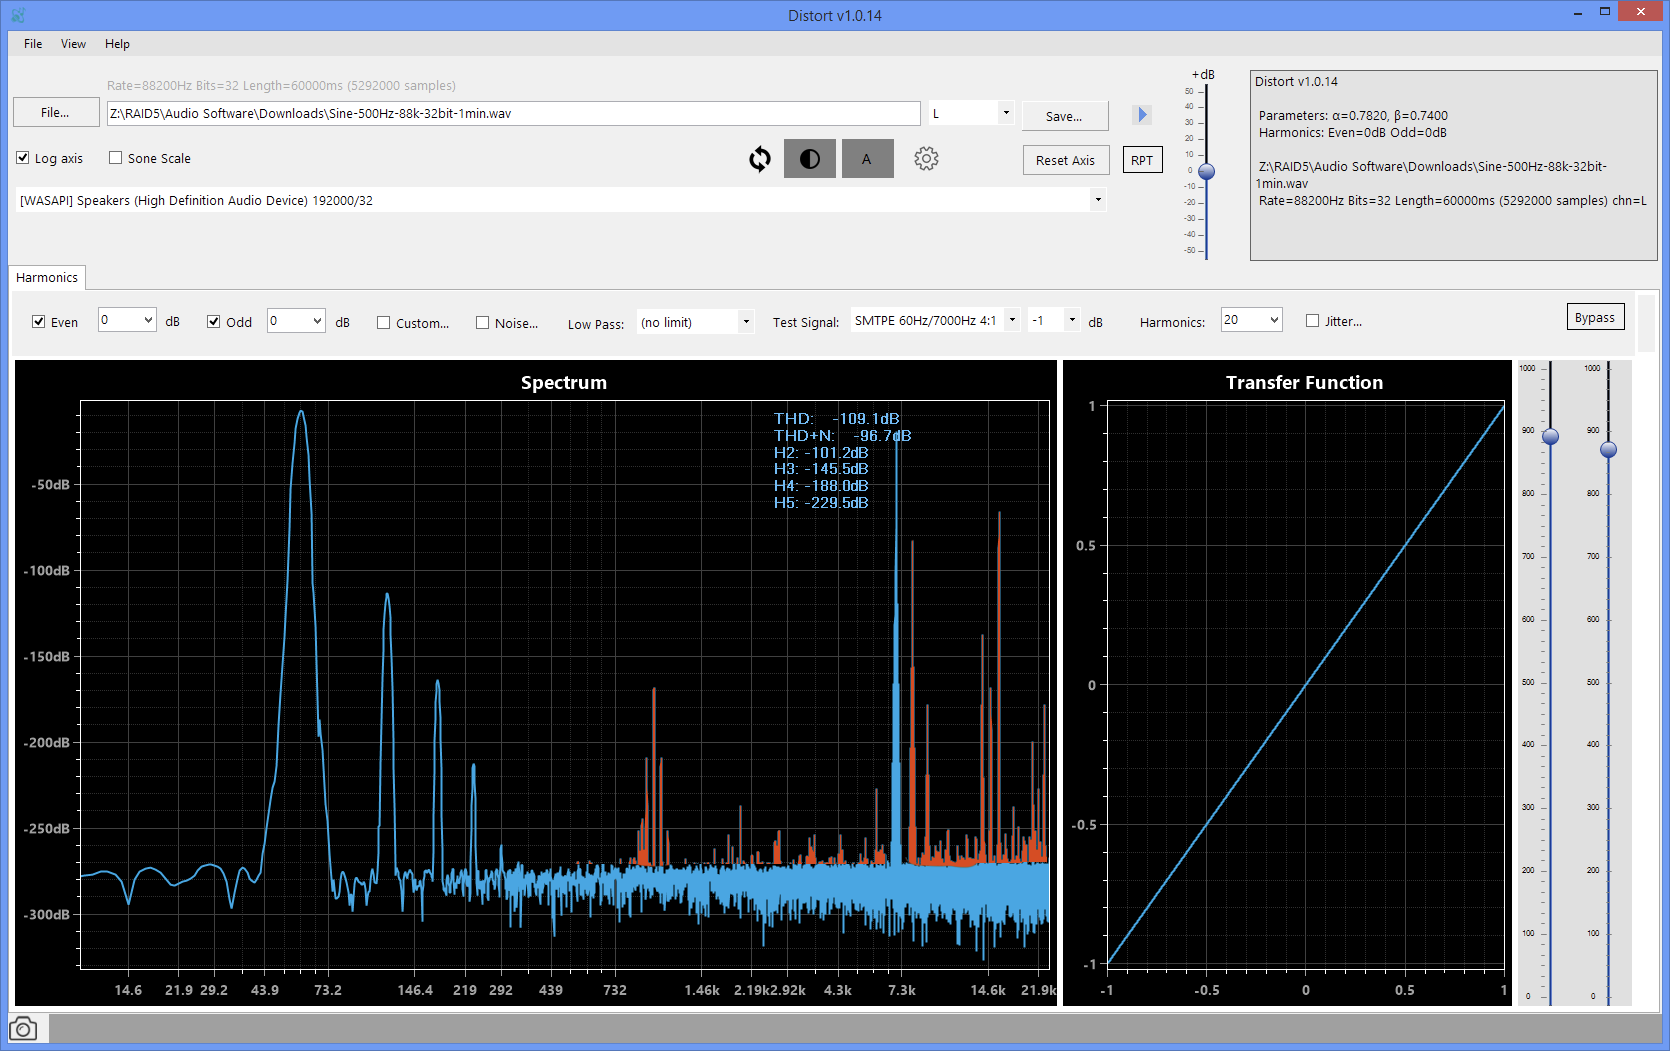
So, at least in theory (and in simulation) ultrasonic and RF energy could potentially interfere with the audible range through IMD/aliasing.

The next step is to confirm that this occurs in a real-world scenario. To start this process, I just placed an order for a low-end Picoscope and intend to do some simple measurements with it with a few DACs on hand to see how much energy is up there. I'm sure there are folks with access to much, much better scope and analyzer equipment. Would love to see some test results similar to what @Miska posted with other DACs and any thoughts on why this effect is or isn't real and/or significant.
 

pma

Major Contributor
Joined
Feb 23, 2019
Messages
4,602
Likes
10,769
Location
Prague
Is DAC ultrasonic/RF output important?

In my honest it is very important, as I have stated in several threads here and have shown measurements as well. However, it is an unpopular topic, because both DACs and class D usually produce a plenty of ultrasound and VHF noise and spectral lines.
 
OP
pkane

pkane

Master Contributor
Forum Donor
Joined
Aug 18, 2017
Messages
5,677
Likes
10,311
Location
North-East
In my honest it is very important, as I have stated in several threads here and have shown measurements as well. However, it is an unpopular topic, because both DACs and class D usually produce a plenty of ultrasound and VHF noise and spectral lines.

I see the reaction that @Miska gets when he mentions this, and my initial reaction was along the same lines: who could possibly care what happens at 10Mhz? But I do like to question my own assumptions and often this leads me down a path I didn't expect :) That's the part I enjoy the most.
 
Last edited:
  • Like
Reactions: pma

mansr

Major Contributor
Joined
Oct 5, 2018
Messages
4,685
Likes
10,703
Location
Hampshire
With my distortion simulation tool, DISTORT, I was able to confirm that aliasing and IMD from high-frequency noise/signal could be reflected below 24kHz. Here's a simple 2-tone (SMTPE 60Hz/7kHz) IMD test with two RF-frequency tones added in the presence of some minor non-linear distortion. The two spurious tones are at 1MHz @ -50dB and 10MHz @ -60dB. Red components are caused by the RF signal:

image.png.89bd5bd2ffe5616fa66358c9a60dfb3d.png
What exactly is the distortion function you're using there?
 
OP
pkane

pkane

Master Contributor
Forum Donor
Joined
Aug 18, 2017
Messages
5,677
Likes
10,311
Location
North-East
What exactly is the distortion function you're using there?

It's a non-linear transfer function. DISTORT allows this to be varied using two parameters, α and β. End result is a variable exponential function, something like this (this one is much more severe):
1577553714420.png


The distortions used for the RF test above applied to just a single 0dBFS 1kHz tone:
1577553849216.png
 
Last edited:

mansr

Major Contributor
Joined
Oct 5, 2018
Messages
4,685
Likes
10,703
Location
Hampshire
It's a non-linear transfer function. DISTORT allows this to be varied using two parameters, α and β. End result is a variable exponential function, something like this (this one is much more severe):
index.php
I understand that. I'm asking exactly what function you used for this test so that I might replicate it using other software.
 

Blumlein 88

Grand Contributor
Forum Donor
Joined
Feb 23, 2016
Messages
20,706
Likes
37,443
I still don't see the worry until it significantly corrupts the 20 khz and below range. That is all we can hear. As you show such distortion would show up in the audible range. We could see it with measures to only 20 khz, but might not know from where it was originating. I've not seen such things at those levels in any DAC I've had hands on. And while the ADC has an input filter, it wouldn't filter out the IMD products if they had already occurred in the below 20 khz range. In real listening the speakers and your ears also form a filter.

Now otherwise I'm not worried about speakers reacting to 1 mhz. Some class D or wide bandwidth amps could react. Again if that results in below 20 khz spurious tones you'll see it, and if it doesn't you'll not hear it.

So get Miska to give you a list of DACs with these problematic mhz tones or noise in them. Hook it up to some amps and measure at the speaker terminals. You'll know easily enough if it is a problem.
 
OP
pkane

pkane

Master Contributor
Forum Donor
Joined
Aug 18, 2017
Messages
5,677
Likes
10,311
Location
North-East
I still don't see the worry until it significantly corrupts the 20 khz and below range. That is all we can hear. As you show such distortion would show up in the audible range. We could see it with measures to only 20 khz, but might not know from where it was originating. I've not seen such things at those levels in any DAC I've had hands on. And while the ADC has an input filter, it wouldn't filter out the IMD products if they had already occurred in the below 20 khz range. In real listening the speakers and your ears also form a filter.

Now otherwise I'm not worried about speakers reacting to 1 mhz. Some class D or wide bandwidth amps could react. Again if that results in below 20 khz spurious tones you'll see it, and if it doesn't you'll not hear it.

So get Miska to give you a list of DACs with these problematic mhz tones or noise in them. Hook it up to some amps and measure at the speaker terminals. You'll know easily enough if it is a problem.

that’s the plan. I have a NOS DAC that does appear to generate a bit of high frequency energy, and according to Miska, the little Forte also does. I’d want to see if any of this is reflected at the output of a reasonable amp or preamp, in the audible range.
 

pma

Major Contributor
Joined
Feb 23, 2019
Messages
4,602
Likes
10,769
Location
Prague
Spectrum analysis is perfect for periodic signals and THD calculates with harmonic frequencies. Both is not necessarily the case, when we talk about EMI HF intermodulation products. Non-periodic signals will tend to be smaller in amplitude in the spectrum and when averaging is used, they are again suppressed. So sometimes a 3D spectrum plot is helpful. I have recently measured an IMD product that was wandering from right to left and back, on the screen. Spectrum analysis is not so powerful for non-periodic signals with variable frequency. And we have many more signal types.

1577564694568.png
 

mansr

Major Contributor
Joined
Oct 5, 2018
Messages
4,685
Likes
10,703
Location
Hampshire
@pkane how does your simulation work? Are you sure you're not undersampling those high frequencies and getting aliasing? That's the only way I can produce anything resembling your result.
 

LTig

Master Contributor
Forum Donor
Joined
Feb 27, 2019
Messages
5,816
Likes
9,539
Location
Europe
The next step is to confirm that this occurs in a real-world scenario. To start this process, I just placed an order for a low-end Picoscope and intend to do some simple measurements with it with a few DACs on hand to see how much energy is up there. I'm sure there are folks with access to much, much better scope and analyzer equipment. Would love to see some test results similar to what @Miska posted with other DACs and any thoughts on why this effect is or isn't real and/or significant.
Be careful with this kind of DSO. See here and here how I fooled myself when I measured the output of my DAC.
 

restorer-john

Grand Contributor
Joined
Mar 1, 2018
Messages
12,679
Likes
38,780
Location
Gold Coast, Queensland, Australia
I find this really ironic.

Before CD was even released, several major brands of power amplifier manufacturers made a point of providing filtered inputs for use with digital sources due to the likely presence of switching/sampling frequency artifacts affecting their wideband (>300KHz) amplifiers in a negative way.

An example from 1983:
1577573758514.jpeg


The bottom line is this. If all digital/pwm sources were correctly designed in the first place, and produced no out-of-band spuriae, there would be absolutely no problem.
 

MC_RME

Addicted to Fun and Learning
Technical Expert
Audio Company
Joined
May 15, 2019
Messages
871
Likes
3,613
The next step is to confirm that this occurs in a real-world scenario. To start this process, I just placed an order for a low-end Picoscope

I hope not! The only Picoscope that can be used for audio is the 4262. Not only because it has 16 bit resolution. Even more important is a parameter often overlooked that renders all other scopes (including other Picoscope ones with 16 bit modes) useless: SFDR (Spurious Free Dynamic Range) is about 100 dB on the 4262. On others less than 80 dB. Here is an example of a measurement from the 5244B with shorted input that clearly shows whatever you measure will be full of random needles that distract and confuse the measurement result.

5244B Störungen Eingang kurzgeschlossen.png


And once you start with this, especially when talking about aliasing and down-mirrored HF signals, you will have to buy a bunch of passive Low Pass filters, available from Thor Labs, Crystek etc, which need to match the current sample rate set at the DSO. Other than ADCs, DSOs do not have any aliasing filter in their inputs, and if so they don't scale with the time setting. Finally you will find that the filters only work correctly with precise impedance matching. Yes, it's not that easy as it might look first.

Kudos to @Miska who shared a lot of his knowledge on these things. His superb out-of-band measurements are a class of its own.
 
Last edited:
OP
pkane

pkane

Master Contributor
Forum Donor
Joined
Aug 18, 2017
Messages
5,677
Likes
10,311
Location
North-East
I hope not! The only Picoscope that can be used for audio is the 4262. Not only because it has 16 bit resolution. Even more important is a parameter often overlooked that renders all other scopes (including other Picoscope ones with 16 bit modes) useless: SFDR (Spurious Free Dynamic Range) is about 100 dB on the 4262. On others less than 80 dB. Here is an example of a measurement from the 5244B with shorted input that clearly shows whatever you measure will be full of random needles that distract and confuse the measurement result.

View attachment 43951

And once you start with this, especially when talking about aliasing and down-mirrored HF signals, you will have to buy a bunch of passive Low Pass filters, available from Thor Labs, Crystek etc, which need to match the current sample rate set at the DSO. Other than ADCs, DSOs do not have any aliasing filter in their inputs, and if so they don't scale with the time setting. Finally you will find that the filters only work correctly with precise impedance matching. Yes, it's not that easy as it might look first.

Kudos to Miska who shared a lot of his knowledge on these things. His superb out-of-band measurements are a class of its own.

Well, no didn't order that one, but then again, this is not for audio measurements. This is for looking at the larger artifacts up to and beyond 1MHz. For audio I have a pretty nice, low noise and distortion audio interface that works just fine with much better than 16 bits linearity and 192kHz sampling rate.
 
Last edited:
OP
pkane

pkane

Master Contributor
Forum Donor
Joined
Aug 18, 2017
Messages
5,677
Likes
10,311
Location
North-East
First couple of measurements. This is with the lowest of the low, entry-point Picoscope 2204A.

Holo Spring R2R DAC in NOS mode, PCM192, an REW sweep of 0 to 22kHz playing continuously. Capture mode peak-hold. Interesting artifact around 200kHz similar-looking to one in Miska's capture of Holo Spring 2, although his was a different signal and at a different rate. Not enough memory on this Picoscope for larger sized FFTs to lower the noise floor a bit more:

1577591483917.png


Using Apogee Element24 as the DAC, also at 192K, but in the standard OS mode (doesn't have NOS mode):
1577592031705.png


And extending Apogee capture to 10MHz:
1577592094148.png


So there's some possible ultrasonic energy with Holo Spring R2R in NOS mode, but Apogee Element24 appears to be much cleaner. I'll need a larger size memory on the Picoscope to see if I can dig further down below the noise in the above captures. But an 8-bit ADC is likely to be the limit here.
 

Blumlein 88

Grand Contributor
Forum Donor
Joined
Feb 23, 2016
Messages
20,706
Likes
37,443
What you show around 200 khz looks like the imaging either side of the split around 192 khz to me.

If you will show the same sweep in Audacity in spectrogram view you would be able to tell.
 
OP
pkane

pkane

Master Contributor
Forum Donor
Joined
Aug 18, 2017
Messages
5,677
Likes
10,311
Location
North-East
What you show around 200 khz looks like the imaging either side of the split around 192 khz to me.

If you will show the same sweep in Audacity in spectrogram view you would be able to tell.

Very likely considering the placement around 192kHz. I'll need a higher sampling rate ADC to capture this, though, than the little 192kHz Apogee.
 

Blumlein 88

Grand Contributor
Forum Donor
Joined
Feb 23, 2016
Messages
20,706
Likes
37,443
Very likely considering the placement around 192kHz. I'll need a higher sampling rate ADC to capture this, though, than the little 192kHz Apogee.
Yes you will. For some reason I was thinking the Apogee went to 384 khz, but then realized it is 192 khz. You could play a tone at 15 khz and then one at 20 khz and see where they show up on the Picoscope to determine if it is just imaging.
 
Top Bottom