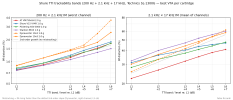
Trackability (Shure TTI bands): 5 cartridges, several VTF/VTA settings
As promised, the trackability results.
Disclosure (per forum AI policy): the analysis script was written with Anthropic's Claude (Opus 5.5) in an iterative session where I supplied the recordings and checked the results. Recordings and setup are mine. Script available on request.
Setup
Technics SL-1300G, miniDSP ADept, 192 kHz / 24-bit captures.
Loads: AT at 90 pF / 33 kΩ, all others at 140 pF / 50 kΩ.
VTF measured with a gauge. "VTA" is the Technics arm-height scale in mm.
Test signal and why
Shure TTI bands (TTR-117, 45 rpm): 200 Hz + 2.1 kHz + 17 kHz played together at six levels (+2, +2, +1, +1, +1 dB steps).
The math model: while the stylus stays in contact with groove, its tip can’t exactly follow the shape the cutter made. That tracing error grows with how sharply the groove bends, so the IM percentage rises in step with the cut level, 1 dB per dB:
IM ≈ √2 · π · r · U₁ · f₂ / v² (r = tip radius, U₁ = low-tone cut velocity, f₂ = higher tone, v = groove speed)
Mistracking breaks this model: once the stylus loses contact, IM rises much faster, and that upward kink is what the test detects.
Each tone loads a different part of the cartridge: 200 Hz tests compliance, 2.1 kHz damping, and 17 kHz tip mass. Playing them together puts the high frequencies on top of large low-frequency excursions, as music does, and mistracking shows up as easy-to-measure intermodulation. The bands are lateral, so a channel that fails on its own points to skating or anti-skate.
There might be more demanding tests, but this was devised by Shure to show off their supreme tracking ability. It is probably good enough for most practical purpose.
Method
- IM-LF = the 2.1 kHz ±200 / ±400 Hz sidebands relative to the 2.1 kHz tone.
- IM-HF = the 17 kHz ±2.1 kHz sidebands relative to the 17 kHz tone.
- Mistracking: with the stylus in contact, the IM percentage rises about 1 dB for each dB of level (the dotted line in the plot). Mistracking shows as a steeper rise. I flag excess growth above about 1 dB over levels 4–6.
Results
Best VTA per cartridge. Left: worst channel. Right: mean of the two channels. The Pickering is with the brush down.
Spread across all the VTAs I tested (level 6):
Code:
Cart                 VTF (g)  VTA tested  IM-LF %     IM-HF %      Mistrack (dB)
AT VM750xSH          2.0      0 - 2.0     1.73-1.83   40.9-41.4     0.4 - 0.6
Shure V15 V-MR       1.0      0 - 2.0     1.82-1.89   46.8-47.0     0.3 - 0.4
Pickering XSV-3000   2.0      2.0 - 4.0   1.57-1.68   47.1-49.6    -0.1 - 0.7
Stanton 881S         1.0      2.0 - 4.0   1.50-1.54   60.2-62.9    ~0
Dynavector 10x3      1.8      1.5 - 3.0   3.42-3.76   61.8-64.0     4.0 - 4.8
Dynavector 10x3      2.0      2.5         2.52        58.4          2.0
Cartridges have different heights, each cartridge VTA range is adjusted to that.
Findings
1. Every cartridge except the Dynavector tracks all six levels cleanly.
2. The AT VM750xSH has the lowest IM-HF (41% vs 47% for the V15) and matches the V15 on IM-LF.
3. The Dynavector mistracks on the right channel only, at levels 5–6. Its left channel stays at about 0.9% IM-LF. Going from 1.8 g to 2.0 g helped but didn't cure it, so this is anti-skate.
4. VTA makes no difference beyond the session-to-session scatter.
@Thomas_A, two caveats: my range is only about 1° of SRA (0–4 mm on a ~230 mm arm), and these bands are lateral, so vertical modulation isn't tested.
Limitations
Shure TTI record 45 rpm is a little easier on groove curvature than 33 rpm LP inner grooves. Levels top out at L6, so a pass doesn't show the remaining margin.