• WANTED: Happy members who like to discuss audio and other topics related to our interest. Desire to learn and share knowledge of science required. There are many reviews of audio hardware and expert members to help answer your questions. Click here to have your audio equipment measured for free!

How to compare these two amp power charts?

Daniel7

Member
Joined
May 4, 2023
Messages
23
Likes
1
The NAD review mentions a 1kHz test tone & continuous (RMS) power. Do we know what tone is used in the ASR measure, and if it is peak vs continuous (RMS) power?

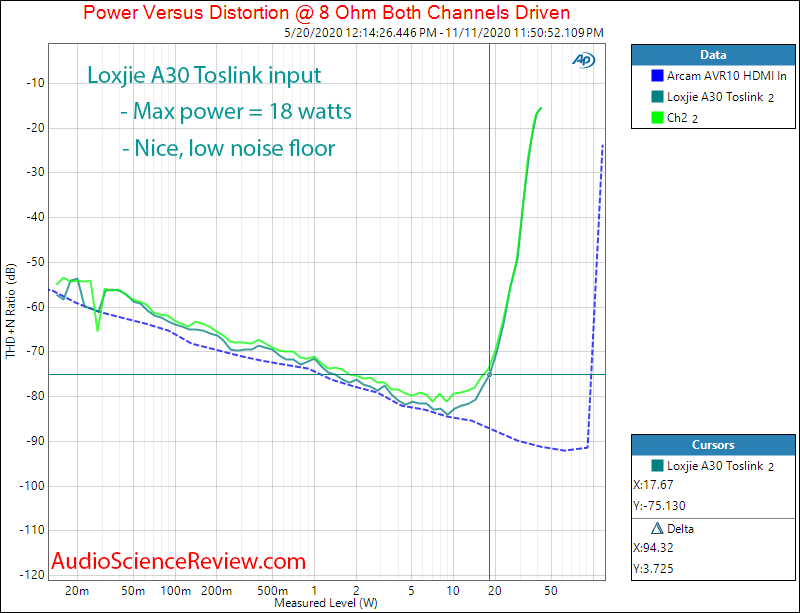
I'm trying to compare RMS power into 8 ohm loads but I'm not sure how to interpret these two charts to compare what these two amps can do.

Loxjie A30:
index.php


NAD D3020 V1:
415NADfig13.jpg


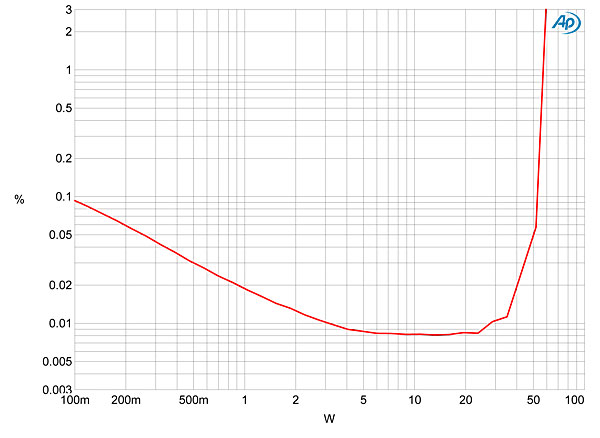
Fig.13 NAD D 3020, distortion (%) vs 1kHz continuous output power into 8 ohms.
"The minimum distortion level was low, and the D 3020 clipped (defined as when the THD+N reaches 1%) at 58Wpc into 8 ohms (17.6dBW)"
 
Last edited:

jasonhanjk

Active Member
Joined
Mar 24, 2019
Messages
252
Likes
180
They both uses 1kHz. The NAD have better spec in terms of power.
Both THD+N for both graph are quite similar if ignore it's max output power.
 
OP
D

Daniel7

Member
Joined
May 4, 2023
Messages
23
Likes
1
They both uses 1kHz. The NAD have better spec in terms of power.
Both THD+N for both graph are quite similar if ignore it's max output power.
I'd like to compare the two charts in order to get an apples to apples figure on RMS output. Do you know how I could do that?
 

Matias

Master Contributor
Forum Donor
Joined
Jan 1, 2019
Messages
5,081
Likes
10,935
Location
São Paulo, Brazil
First of all the Y axis scale 0.01% is -80 dB. Both graphs reach or exceed slightly below that, so they are practically the same in noise and distortion.

But max power defined by 1% THD+N which is -40 dB, one is about 30W while the other some 47W.

But the question is why are you comparing 8 ohms graphs to begin with? Most speakers nowadays are closer to 4 ohms, which is more demanding of the amplifier (higher current). You should be comparing them in 4 ohms to be more relevant imo.
 

DVDdoug

Major Contributor
Joined
May 27, 2021
Messages
3,024
Likes
3,980
Amir is measuring continuous RMS. Most modern amplifiers can't put-out much more peak-power than RMS because they have regulated power supplies that don't sag very much when stressed. But I think some manufacturers measure peak power at 10% distortion or something like that to make the spec as high as possible.

With regular program material, of course the amplifier is never putting-out full-continuous power. But it's a "standard" measurement and it's a good-conservative spec. We don't mind if the amp can put-out higher occasional peaks.

I don't trust manufacturer's specs. Even the "reputable" manufacturers seem to fudge a bit. :(
 

Doodski

Grand Contributor
Forum Donor
Joined
Dec 9, 2019
Messages
21,576
Likes
21,868
Location
Canada
I'd like to compare the two charts in order to get an apples to apples figure on RMS output. Do you know how I could do that?
@ what level of THD + Noise? Give it to me either in dB or %.
 

Doodski

Grand Contributor
Forum Donor
Joined
Dec 9, 2019
Messages
21,576
Likes
21,868
Location
Canada
How is that conversion done (I’m sure it’s a simple formula but I don’t know where to start)?
Use this calc.>>>
 
OP
D

Daniel7

Member
Joined
May 4, 2023
Messages
23
Likes
1
@ what level of THD + Noise? Give it to me either in dB or %.

This raises a good question & I don't have any kind of grasp on what occurs along the range of THD, how certain thresholds might translate to listening experience.

It seems published and discussed specs are all over the board on THD. Is there a good rule of thumb or way to look at power spec charts in relation to THD?
 

Doodski

Grand Contributor
Forum Donor
Joined
Dec 9, 2019
Messages
21,576
Likes
21,868
Location
Canada
@Daniel7 I think 0.1% THD + Noise is a fair number for this specific use case. It's low enough you'll have your bases covered for higher frequencies and still get a good wattage figure from the amps.
 

GXAlan

Major Contributor
Forum Donor
Joined
Jan 15, 2020
Messages
3,917
Likes
6,049
How is that conversion done (I’m sure it’s a simple formula but I don’t know where to start)?

Medium simple or medium complex depending how you look at it. Easy enough to use this website :)
 

theREALdotnet

Major Contributor
Joined
Mar 11, 2022
Messages
1,202
Likes
2,073
OP
D

Daniel7

Member
Joined
May 4, 2023
Messages
23
Likes
1
But the question is why are you comparing 8 ohms graphs to begin with? Most speakers nowadays are closer to 4 ohms, which is more demanding of the amplifier (higher current). You should be comparing them in 4 ohms to be more relevant imo.
I'm using some older Mirage 8-ohm speakers that can handle ~50w.
 
Last edited:
OP
D

Daniel7

Member
Joined
May 4, 2023
Messages
23
Likes
1
Does anyone know if there's a THD value that Amir always measures to, and if so what it would be in %?

For example on this chart how did he determine where to stop measurement on the A30?

index.php
 

Matias

Master Contributor
Forum Donor
Joined
Jan 1, 2019
Messages
5,081
Likes
10,935
Location
São Paulo, Brazil
Does anyone know if there's a THD value that Amir always measures to, and if so what it would be in %?

For example on this chart how did he determine where to stop measurement on the A30?

index.php
Visually, from where it starts to rise.
 

solderdude

Grand Contributor
Joined
Jul 21, 2018
Messages
16,035
Likes
36,400
Location
The Neitherlands
Does anyone know if there's a THD value that Amir always measures to, and if so what it would be in %?

For example on this chart how did he determine where to stop measurement on the A30?

The measurement stopped at -15dB (20% dist @ 1kHz, 40W in 8ohm)
It is unclear why, could be limited by the gain of the amplifier (and max input voltage) or some other reason. When protection kicks in the tell tale sign is a sharp bend to the left which is not seen in this plot.
The cursor was set at -75dB (18W in 8ohm) which is around 0.02% so can assume that's where Amir draws 'a line'.

Amir usually eyeballs where the distortion starts to rise (sharply). This may not always be at the exact same distortion level.

You can easily convert level to % (and the other way around) with THIS online calculator
 

notsodeadlizard

Senior Member
Joined
Feb 18, 2023
Messages
403
Likes
362
Nobody counts logarithms in their minds (except geeks), so just remember the rule "10 times less percentage means -20 less decibel" and if I may say so, "threshold numbers":
1% THD is -40 dB
0.1% THD is -60 dB
0.01% THD is -80 dB
0.001% THD is -100 dB

Above 18 watts of power output, this Loxjie (how can you pronounce it at all?) flies into the wastebasket.
NAD is still OK till 48W approximately.
 

RayDunzl

Grand Contributor
Central Scrutinizer
Joined
Mar 9, 2016
Messages
13,250
Likes
17,186
Location
Riverview FL
How is that conversion done (I’m sure it’s a simple formula but I don’t know where to start)?

 
Top Bottom