Here is the explanation without math. I will probably create a mini-article out of it later.
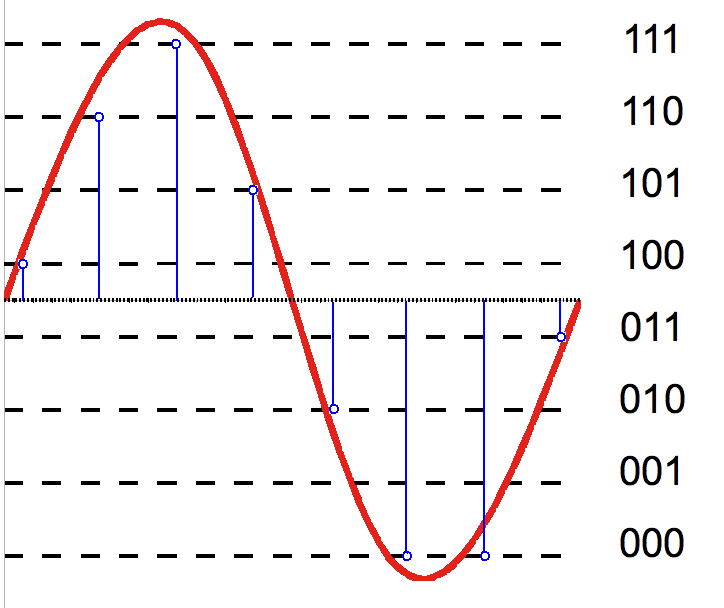
The key to understanding this is to realize what is being measured. The core is the idea of how would an ideal analog to digital converter work when sampling an analog signal into discrete digital values. Wiki has a nice picture of this although I am sure we all can imagine it also:
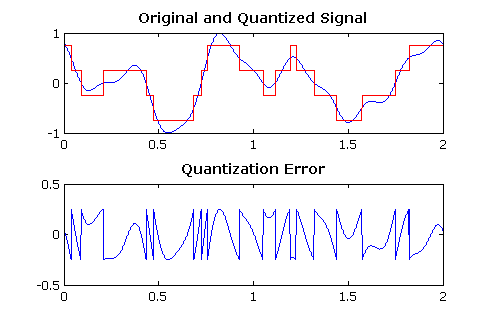
The top graph shows the analog waveform in blue and discrete, sampled values by the analog to digital converter. Naturally since we don't have infinite sample resolution, we can't track the original signal completely faithfully. The graph below shows the error between what we sampled digitally and the difference between the two.
We can compute this error if we assume the source is sinusoidal:
Doing this then yields the value of signal to noise ratio = 6* number of bits + 1.67
SFDR is computed using the same assumption of sinusoidal input but now we look at the spectrum of the distortion products generated as a result of fixed quantization and compute its highest peak.
Let's look at a real simulation. I created a floating point 1 Khz tone in Adobe Audition. Floating point gives us much more resolution than fixed point 16 or 24 used in audio and as such can be thought of being near analog in resolution. Here is the frequency spectrum of that:
View attachment 5479
We see our main tone at the 1 Khz. No distortion products are visible.
Now I truncate the samples to 8 bits. I don't apply any dither which would simulate sampling an analog signal without dither into 8 bits and look at its spectrum again:
View attachment 5480
Our original tone is on the left at 0 dbfs without change. But what is changed is that I now have tons of distortion products. If we eyeball the highest one we find one around 3 Khz. Again an eyeball shows it to be at -65 dbFS. Per notation on the graph, SFDR is 9 times number of bits minus a fudge factor of "c." The fudge factor is there because this is an approximation. "c" for high-resolution systems is 6 so using that we see that the formula predicts the highest peak to be at -66 dbFS which is essentially a match for our -65 dbFS eyeballing.
The connection to bessel function is that it describes the distribution we see of the distortion products. Using that we can compute the individual peak values. Hence the reason the derivation uses that.
Hope this is more clear now.