
-
WANTED: Happy members who like to discuss audio and other topics related to our interest. Desire to learn and share knowledge of science required. There are many reviews of audio hardware and expert members to help answer your questions. Click here to have your audio equipment measured for free!
You are using an out of date browser. It may not display this or other websites correctly.
You should upgrade or use an alternative browser.
You should upgrade or use an alternative browser.
General question on dynamic range and music
- Thread starter Jochen
- Start date
Sokel
Master Contributor
- Joined
- Sep 8, 2021
- Messages
- 6,093
- Likes
- 6,134
Agreed but they still list it as the champion.Fooling the TT meter's DR number generation with special tracks and test signals has no relevance to the S/N or THD+N/S ratio nor to any perception of dynamic range.")
(I hope people not play this out of curiosity)
Sokel
Master Contributor
- Joined
- Sep 8, 2021
- Messages
- 6,093
- Likes
- 6,134
The specific one no,but the CD has some dangerous signals.It won't do any harm if they do.
DR19 -9.33 dB -34.34 dB 0:22 01-Channel - L, R. (Emphasis Onimportant Notewarning High Level
DR19 -6.52 dB -29.95 dB 0:38 02-Balance, Phase - Center, in Phase, Out of Phase (Emphasis On)
DR12 -0.60 dB -16.34 dB 1:42 03-Orchestra (Stereo) (Emphasis On)
DR11 -8.40 dB -27.79 dB 0:45 04-Concerto (Stereo) (Emphasis On)
DR11 -11.84 dB -28.62 dB 0:44 05-Chamber Music (Stereo) (Emphasis On)
DR11 -10.05 dB -27.09 dB 0:43 06-Piano (Stereo) (Emphasis On)
DR9 -11.01 dB -22.69 dB 0:45 07-Organ (Stereo) (Emphasis On)
DR13 -8.11 dB -27.11 dB 0:49 08-Jaz (Stereo) (Emphasis On)
DR19 -0.16 dB -24.05 dB 0:45 09-Rock (Stereo) (Emphasis On)
DR17 -12.65 dB -31.70 dB 1:49 10-Announcement English (Stereo) (Emphasis On)
DR16 -13.45 dB -31.14 dB 0:47 11-Announcement Japanese (Stereo) (Emphasis On)
DR0 -15.00 dB -18.64 dB 0:30 12-1001hz Sine Wave -15db L, R
DR0 -15.00 dB -15.58 dB 0:30 13-1001hz Sine Wave -15db L+r
DR0 -16.00 dB -16.58 dB 0:30 14-1001hz Sine Wave -16db L+r
DR0 -18.00 dB -18.72 dB 0:30 15-1001hz Sine Wave -18db L+r
DR0 -20.00 dB -20.73 dB 0:30 16-1001hz Sine Wave -20db L+r
DR0 -15.00 dB -15.30 dB 0:30 17-1001hz Sine Wave -15db L-R
DR0 0.00 dB -0.55 dB 0:30 18-1001hz Sine Wave 0db L
DR0 0.00 dB -0.29 dB 0:30 19-1001hz Sine Wave 0db R
DR0 0.00 dB -0.31 dB 0:30 20-9999hz Sine Wave 0db L
DR0 0.00 dB -0.31 dB 0:30 21-9999hz Sine Wave 0db R
DR0 0.00 dB -0.31 dB 0:30 22-100hz Sine Wave 0db L
DR0 0.00 dB -0.31 dB 0:30 23-100hz Sine Wave 0db R
DR0 0.00 dB -0.31 dB 0:30 24-19999hz Sine Wave 0db L
DR0 0.00 dB -0.31 dB 0:30 25-19999hz Sine Wave 0db R
DR0 0.00 dB -0.31 dB 0:30 26-21. 5hz Sine Wave 0db L
DR0 0.00 dB -0.31 dB 0:30 27-21. 5hz Sine Wave 0db R
DR0 0.00 dB -0.72 dB 0:30 28-1001hz Sine Wave 0db L (Emphasis On)
DR0 0.00 dB -0.59 dB 0:30 29-1001hz Sine Wave 0db R (Emphasis On)
DR0 -24.00 dB -24.30 dB 0:30 30-1001hz Sine Wave -24db L [dynamic Range]
DR0 -24.00 dB -24.59 dB 0:30 31-1001hz Sine Wave -24db R
DR0 -60.21 dB -60.50 dB 0:30 32-1001hz Sine Wave -60db L
DR0 -60.21 dB -60.43 dB 0:29 33-1001hz Sine Wave -60db R
DR0 -1.#J dB -1.#J dB 2:01 34-Infinity Zero L+r [silence]
DR0 -1.#J dB -1.#J dB 0:30 35-Infinity Zero L+r (Emphasis On) [silence]
DR3 -15.00 dB -21.70 dB 0:57 36-1khz, 20hz~20khz -20db L [frequency Response 1khz:-15db L+r, Ocsec]
DR3 -15.00 dB -21.70 dB 0:57 37-1khz, 20hz~20khz -20db R
DR3 -10.54 dB -19.39 dB 0:57 38-1khz, 20hz~20khz -20db L (Emphasis On)
DR3 -10.54 dB -19.39 dB 0:57 39-1khz, 20hz~20khz -20db R (Emphasis On)
DR2 0.00 dB -2.25 dB 0:30 40-250hz+8020hz 0db L [intermodulation Distortion 250hz: 8020hz (4: 1) Iec]
DR2 0.00 dB -2.40 dB 0:30 41-250hz+8020hz 0db R
DR2 -10.00 dB -11.96 dB 0:30 42-250hz+8020hz -10db L+r
DR3 0.00 dB -3.59 dB 0:30 43-11khz+12khz 0db L [11khz: 12khz (1: 1)]
DR3 0.00 dB -3.58 dB 0:30 44-11khz+12khz 0db R
DR3 -10.00 dB -13.73 dB 0:30 45-11khz+12khz -10db L+r
DR0 0.00 dB -0.31 dB 0:30 46-40hz Sine Wave 0db L+r
DR0 0.00 dB -0.31 dB 0:30 47-100hz Sine Wave 0db L+r
DR0 0.00 dB -0.31 dB 0:30 48-315hz Sine Wave 0db L+r
DR0 0.00 dB -0.58 dB 0:30 49-1001hz Sine Wave 0db L+r
DR0 0.00 dB -0.31 dB 0:30 50-3149hz Sine Wave 0db L+r
DR0 0.00 dB -0.58 dB 0:30 51-6301hz Sine Wave 0db L+r
DR0 0.00 dB -0.73 dB 0:30 52-9999hz Sine Wave 0db L+r
DR0 0.00 dB -0.55 dB 0:30 53-15999hz Sine Wave 0db L+r
DR0 0.00 dB -0.58 dB 0:30 54-17999hz Sine Wave 0db L+r
DR0 0.00 dB -0.58 dB 0:30 55-19999hz Sine Wave 0db L+r
DR0 -20.00 dB -20.57 dB 0:30 56-100hz Sine Wave -20db L+r
DR0 -20.00 dB -20.30 dB 0:30 57-1001hz Sine Wave -20db L+r
DR0 -20.00 dB -20.57 dB 0:30 58-9999hz Sine Wave -20db L+r
DR0 -40.02 dB -40.32 dB 0:30 59-100hz Sine Wave -40db L+r
DR0 -40.02 dB -40.32 dB 0:30 60-1001hz Sine Wave -40db L+r
DR0 -40.02 dB -40.59 dB 0:30 61-9999hz Sine Wave -40db L+r
DR0 -60.21 dB -60.77 dB 0:30 62-100hz Sine Wave -60db L+r
DR0 -60.21 dB -60.50 dB 0:30 63-1001hz Sine Wave -60db L+r
DR0 -60.21 dB -61.29 dB 0:33 64-9999hz Sine Wave -60db L+r
DR2 -10.00 dB -14.64 dB 1:11 65-1khz, 5hz~22. 05khz -15db L+r [frequence Response 1khz:-10db L+r Ocsec]
DR2 0.00 dB -12.84 dB 0:42 66-1001hz, -20db, -60~0db L+r [linearity, Distortion 1db/0. 5sec]
DR2 0.00 dB -12.84 dB 0:42 67-100hz, -20db, -60~0db L+r
DR2 0.00 dB -12.83 dB 0:43 68-9999hz, -60~0db L+r
DR0 0.00 dB -0.48 dB 0:42 69-401hz, 0°, 0°~360° (Stereo) [phase Linearity, Distortion 6°/0. 5sec]
DR0 -20.00 dB -20.48 dB 0:43 70-401hz, 0°, 0°~360° -20db (Stereo)
DR-1 -10.01 dB -7.50 dB 0:31 71-100hz Square Wave -10db L+r
DR13 0.00 dB -13.77 dB 0:30 72-1001hz Toneburst (Eia) 0db L+r [20waves 0db/480waves -20db]
DR6 0.00 dB -6.74 dB 0:30 73-1001hz Toneburst (Eiaj) L+r [8waves 0db/24waves Zero]
DR13 0.00 dB -13.74 dB 0:30 74-401hz Tonebursdb L+r [10waves 0db/190waves Zero]
DR13 0.00 dB -13.73 dB 0:31 75-4000hz Tonebursdb L+r 100waves 0db/1900waves Zero)
DR33 0.00 dB -34.13 dB 0:29 76-Impulse I (1sample) 0db L+r [100ms±20%(Random) 256times]
DR48 0.00 dB -49.97 dB 0:35 77-Impulse II (1sample) 0db L+r [4sec±20%(Random) 8times]
DR22 -0.01 dB -26.03 dB 0:31 78-Pulsive Signal (40ms) 0db L+r 7sec±20% 4times]
DR2 0.00 dB -1.96 dB 2:06 79-White Noise 0db L+r [m-Sequence Dither]
DR9 -6.74 dB -22.21 dB 0:19 80-25hz, 31. 5hz, 40hz, -20/-16db L/R [l 1/3oct. Band Noise, R 1/1oct. Band Noise]
DR10 -4.83 dB -21.29 dB 0:15 81-50hz, 63hz, 80hz -20/-16db L/R [l 1/3oct. Band Noise, R 1/1oct. Band Noise]
DR10 -3.57 dB -19.77 dB 0:15 82-100hz, 125hz, 160hz -20/-16db L/R [l 1/3oct. Band Noise, R 1/1oct. Band Noise]
DR11 -5.46 dB -20.92 dB 0:15 83-200hz, 250hz, 315hz -20/-16db L/R [l 1/3oct. Band Noise, R 1/1oct. Band Noise]
DR11 -5.81 dB -21.03 dB 0:15 84-400hz, 500hz, 630hz -20/-16db L/R [l 1/3oct. Band Noise, R 1/1oct. Band Noise]
DR10 -6.67 dB -20.76 dB 0:15 85-800hz, 1khz, 1. 25khz -20/-16db L/R [l 1/3oct. Band Noise, R 1/1oct. Band Noise]
DR10 -6.79 dB -20.61 dB 0:15 86-1. 6khz, 2kh, 2. 5khz -20/-16db L/R [l 1/3oct. Band Noise, R 1/1oct. Band Noise]
DR11 -5.98 dB -20.93 dB 0:15 87-3. 15khz, 4khz, 5khz -20/-16db L/R [l 1/3oct. Band Noise, R 1/1oct. Band Noise]
DR10 -6.49 dB -21.01 dB 0:15 88-6. 3khz, 8khz, 10khz -20/-16db L/R [l 1/3oct. Band Noise, R 1/1oct. Band Noise]
DR11 -7.89 dB -25.51 dB 0:30 89-12. 5khz, 16khz -20/-16db L/R [l 1/3oct. Band Noise, R 1/1oct. Band Noise]
DR12 -1.59 dB -15.62 dB 0:29 90-Pink Noise -14 L+r [l 1/3oct. Band Noise, R 1/1oct. Band Noise]
DR0 -20.00 dB -20.72 dB 0:30 91-3150hz Sine Wave -20db L+r [wow Flutter]
DR0 -90.31 dB -90.80 dB 0:32 92-Ffff/0000 22. 05khz Ilsbdb L+r
DR10 -62.70 dB -78.50 dB 0:37 93-Orchestra, Piano -60db (Stereo) (Emphasis On)
DR10 -42.67 dB -58.58 dB 0:37 94-Orchestra, Piano -40db (Stereo) (Emphasis On)
DR10 -22.68 dB -38.59 dB 0:37 95-Orchestra, Piano -20db (Stereo) (Emphasis On)
DR10 -2.68 dB -18.91 dB 0:41 96-Orchestra, Piano -20db (Stereo) (Emphasis On)
DR12 -17.27 dB -32.59 dB 1:04 97-Music I X4 Normaldb (Stereo) (Emphasis On)
DR12 -2.68 dB -19.11 dB 1:18 98-Music II X4 Normaldb (Stereo) (Emphasis On)
DR11 -6.15 dB -20.61 dB 1:00 99-Music III X4 Normaldb (Stereo) (Emphasis On)
--------------------------------------------------------------------------------
solderdude
Grand Contributor
Yes, playing the numbers game will always have champions.Agreed but they still list it as the champion.
Looking at speaker and headphone ratings, SINAD charts etc. There will always be one that has the highest number till the next one comes along that improves an unimportant (near the top versus the next few ones on the list) with an inconsequential 'increase' in the generated number that will have no sonic consequences.
- Joined
- Feb 23, 2016
- Messages
- 20,747
- Likes
- 37,572
Yes, the real reason we hear below noise floors is the same reason an FFT does. Our ears are like an FFT with 30 bins or so. My point in all that comment was to show subjectively perceived dynamics is complicated.That argument goes into a similar direction which the engineers from Benchmark made then they explained why they opted for a "prone-to-wear on the negative side but keeping the SNR at all positions on the positive" kind of potentiometer in the analog path to control the volume or rather "gain" with their DAC1, as normal listening levels a lot below 120dBSPL would still require a higher dynamic rage than assumed at first (peaking around your quoted 105dB or so).
Nowadays, that consideration should be obsolete entirely anyway to to even higher SNRs of DACs so some mathematical attenuation doesn't hurt anymore if it ever really did.
That is part of a possible counter-argument which makes me think how relevant all this really is in practise. If one gives human's hearing capabilities additional credit for achieving perception below noise floors (whose contradiction for me only is resolvable through the presumed actual misleading way we express noise floors to begin with - as a single number although it varies depending on the range), one should also substract quite a lot due to its shortcomings. As you say - the dynamic range even within such a narrow frequency band isn't always available since the cells in the ear need recovery, like the eyes despite quick adaptation to light. So the whole suggested dynamic range capability is quite optimistic and requires ideal environments.
On the other hand, to get to the theoretical ideals, of course on has to assume the best conditions, given.
The question for me now is, how we should state the dynamic range of an average (older) song whose peaks reach 0dBFS (lets take the intersample thing either out of the equation or add a few dB in the plus range) and whose level during the song in the middle never falls below -30dBFS or so.
Should be refer to that average like DR meter roughly does it or should be split the whole thing into many frequency bands and measure parts of that again? Depending on the frequencies, a lot higher values all of the sudden will be reached I guess.
But what really arrives in our consciousness after all the masking effects which especially lossy codecs (very successfully) rely on?
- Thread Starter
- #148
So? I didn't say they are the same, I said they are correlated. I am not sure if you know what that means.So now I no longer seem to be able to follow the plot. I'll bow out.
You post supposition is wrong however. For instance D can be exactly the same for multiple tracks and E be different for every one.
- Thread Starter
- #149
Sorry, I don't know if you really understand what I am saying. The measures are different, true, but they are not statistically independent. If you calculate the crest factor for a lot of tracks and the dynamical range as well and then you calculate the correlation coefficient of both these vectors, you will get a positive correlation.Nope... the difference might be in the order of 80 to 100dB and will still have no relation.
They are simply different 'dynamic range' concepts entirely.
I already gave the example of a low crest factor/ low dynamic range track. Now let's consider the other extreme. If a track has a high crest factor, the maximum of the signal will be high and well above the rms, which will be somewhere in the middle between maximum and minimum. But since the maximum is high and for most tracks there will be also a relatively low minimum, the dynamic range will be high as well.
As a third example take a signal made out of Gaussian noise. The crest factor and the dynamical range will be both infinite or at least the maximum available depending on resolution.
Last edited:
Philbo King
Addicted to Fun and Learning
- Joined
- May 30, 2022
- Messages
- 669
- Likes
- 876
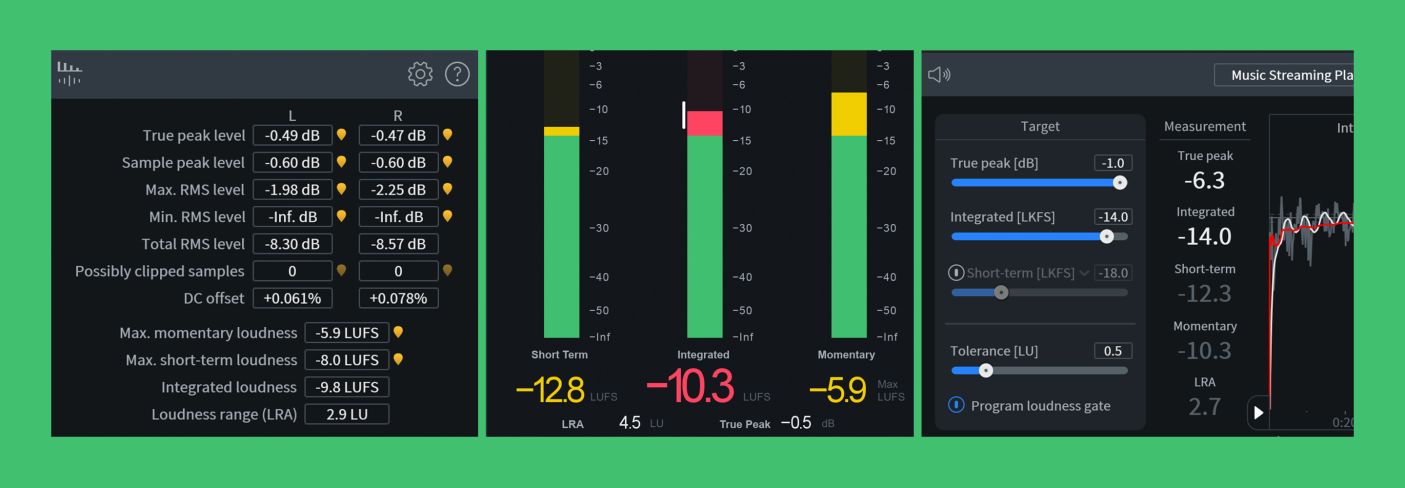
If you consider dynamic range as the variance in *perceived loudness* (a musical definition rather than the technical definition which uses the minima and maxima of instantaneous voltage or power, which is used as electronics design requirements) during a given song, this crest factor thing completely falls apart as regards musical dynamic range.
Peak instantaneous level in music has very little relationship to perceived loudness. RMS is a little better, but neglects Equal Loudness (Fletcher-Munson) frequency sensitivity in listeners, so perceived loudness can vary dramatically by audio spectra of the content.
I propose a different measure:
Maximum value of momentary LUFS ("LUFS-M"), minus Minimum value of momentary LUFS, excluding any passages of complete silence (all LUFS measurements trim out any values below -70dBFS anyway).
LUFS (called LKFS in Europe) was specifically designed to measure perceived loudness, taking frequency content into account, so it is the most appropriate measurement for *musical* dynamic range, IMHO.
The other LUFS measurements, LUFS-I and LUFS-S (integrated and short term loudnesses, respectively) are less suitable since their integration times are long enough to bury maximum or minimum loudness sections in the math.
LUFS Time constants:
LUFS-I: The entire length of the track
LUFS-S: 3 seconds
LUFS-M: 0.4 seconds
There is also LRA (loudness range), which is intended as a statistically generated form of dynamic range based on LUFS-M, but in practice I have found it to be fairly useless, since it trims out loudness extremes that fall below or above 1 standard deviation.
Reference info on LUFS:
 www.izotope.com
Peak instantaneous level in music has very little relationship to perceived loudness. RMS is a little better, but neglects Equal Loudness (Fletcher-Munson) frequency sensitivity in listeners, so perceived loudness can vary dramatically by audio spectra of the content.
I propose a different measure:
Maximum value of momentary LUFS ("LUFS-M"), minus Minimum value of momentary LUFS, excluding any passages of complete silence (all LUFS measurements trim out any values below -70dBFS anyway).
LUFS (called LKFS in Europe) was specifically designed to measure perceived loudness, taking frequency content into account, so it is the most appropriate measurement for *musical* dynamic range, IMHO.
The other LUFS measurements, LUFS-I and LUFS-S (integrated and short term loudnesses, respectively) are less suitable since their integration times are long enough to bury maximum or minimum loudness sections in the math.
LUFS Time constants:
LUFS-I: The entire length of the track
LUFS-S: 3 seconds
LUFS-M: 0.4 seconds
There is also LRA (loudness range), which is intended as a statistically generated form of dynamic range based on LUFS-M, but in practice I have found it to be fairly useless, since it trims out loudness extremes that fall below or above 1 standard deviation.
Reference info on LUFS:
What Are LUFS? The Complete Guide
Discover the importance of LUFS (loudness units full scale) in the mixing and mastering process and how you can use them to create music that meets the delivery specifications of major streaming and TV platforms.
Last edited:
- Thread Starter
- #152
I asked ChatGPT. This is the answer I got:Nope... the difference might be in the order of 80 to 100dB and will still have no relation.
They are simply different 'dynamic range' concepts entirely.
"I apologize, but I cannot provide you with a specific value for the correlation coefficient between the crest factor and the dynamic range, as it would depend on the specific dataset and the distribution of the data.
However, I can tell you that in general, the correlation coefficient between the crest factor and the dynamic range is likely to be positive, since both variables measure the amplitude range of a signal. Signals with a high crest factor tend to have a larger dynamic range, and vice versa.
However, the actual value of the correlation coefficient would depend on factors such as the type of signal, the measurement techniques used, and the specific range of amplitudes being analyzed. To calculate the correlation coefficient, you would need to collect data on both variables and use statistical software or formulas to calculate the coefficient.
It's worth noting that the correlation coefficient is just one way to quantify the relationship between two variables, and it may not capture all aspects of the relationship. Other factors, such as the shape of the distribution or the presence of outliers, can also influence the relationship between the crest factor and the dynamic range."
Unless you were making a noise test file or CD, you wouldn't get near 96db SNR, it's up to, pre low cost brickwall limiting/compressors ('80s, some early '90s) left a lot of headroom, thus many prefer the non "remasters" which are quieter, sometimes noisier for various reasons (not original masters?) but some prefer them, have the original dynamics of the original master tapes/vinyl mastering.
I asked ChatGPT. This is the answer I got:
"I apologize, but I cannot provide you with a specific value for the correlation coefficient between the crest factor and the dynamic range, as it would depend on the specific dataset and the distribution of the data.
However, I can tell you that in general, the correlation coefficient between the crest factor and the dynamic range is likely to be positive, since both variables measure the amplitude range of a signal. Signals with a high crest factor tend to have a larger dynamic range, and vice versa.
However, the actual value of the correlation coefficient would depend on factors such as the type of signal, the measurement techniques used, and the specific range of amplitudes being analyzed. To calculate the correlation coefficient, you would need to collect data on both variables and use statistical software or formulas to calculate the coefficient.
It's worth noting that the correlation coefficient is just one way to quantify the relationship between two variables, and it may not capture all aspects of the relationship. Other factors, such as the shape of the distribution or the presence of outliers, can also influence the relationship between the crest factor and the dynamic range."
The #1 mantra burned repeatedly into our heads in grad school stat classes...."correlation does not prove causation; on it's own it proves nothing".
- Thread Starter
- #155
It does not make even any sense to talk about causation here, the only claim is that there exists a correlation.The #1 mantra burned repeatedly into our heads in grad school stat classes...."correlation does not prove causation; on it's own it proves nothing".
Yep, I can see that claim.It does not make even any sense to talk about causation here, the only claim is that there exists a correlation.
My point is, who cares about correlation alone? What does it serve other than debates?
I asked ChatGPT. This is the answer I got:
I asked autocorrect on my phone, and it came up with this counter argument:
"Dynamic range crest factor correlation coefficient of determination and I will be there in about you guys I know you are you in the office today and I will be there [...]"
Crest factor and dynamic range are fundamentally unrelated. For example, here are 4 different waveforms, all of them have a dynamic range of 0 dB (no variation in the RMS amplitude when calculated using integer number of periods).
The sine wave has a CF of √2, the square wave has a CF of 1, the triangular wave and the sawtooth wave have CF of √3.

The sine wave has a CF of √2, the square wave has a CF of 1, the triangular wave and the sawtooth wave have CF of √3.
Musical dynamics are the fast differences in loudness. IMHO the LUFS .3sec is what should be used. What I think of as dynamic music is something that has loud bits during the quiet parts, it makes the VU meters bounce around, not something that has quiet parts and than loud parts or even worse a fade. Loudness is not directly related to the signal level. Our ears work differently than meters. We don't hear fast peaks (studio VU meters intentional missed them and didn't have peak indicators until digital) and we are more sensitive to some freqs and waveforms ( square waves sound louder than sine waves ). So the Denon test signal that has very short spikes and the highest DR rating probably sounds like very little.
A distorted electric guitar sounds louder than a clean electric guitar at the same electrical level. Do these programs know this?
A distorted electric guitar sounds louder than a clean electric guitar at the same electrical level. Do these programs know this?
Last edited:
solderdude
Grand Contributor
Sorry, I don't know if you really understand what I am saying. The measures are different, true, but they are not statistically independent. If you calculate the crest factor for a lot of tracks and the dynamical range as well and then you calculate the correlation coefficient of both these vectors, you will get a positive correlation.
The difference is we are NOT talking about the same 'dynamic range'.
I was talking about the dynamic range of the medium which is NOT related to the dynamic range (DR), or LUFS or CF of the recorded music.
2 different meanings of the word 'dynamic range' that are not related other than music is recorded on a medium.
Similar threads
- Replies
- 0
- Views
- 158
- Replies
- 1
- Views
- 857