• WANTED: Happy members who like to discuss audio and other topics related to our interest. Desire to learn and share knowledge of science required. There are many reviews of audio hardware and expert members to help answer your questions. Click here to have your audio equipment measured for free!

Genelec on audio science

Floyd Toole

Senior Member
Audio Luminary
Technical Expert
Industry Insider
Forum Donor
Joined
Mar 12, 2018
Messages
367
Likes
3,905
Yes, Andrew Marshall believed in the. usefulness of measurements and did his own. Unfortunately, they were not always comprehensive, not revealing off-axis first reflection or sound power data that matters in rooms. The other Canadian magazines, AudioScene Canada and Sound Canada, paid for measurements and double-blind listening tests to be done at the National Research Council. That is history. Soundstage.com still publishes limited, but useful, anechoic data from my old NRCC lab.

Some US publications wanted to have such data for reviews but the cost and complications of shipping, customs, etc., getting products into and out of Canada in a timely manner, were big obstacles. It would have been interesting to see what might have evolved if that had happened. One of those publications went on to do only totally subjective reviews: no measurements, and uncontrolled, sighted, listening tests - opinions only. :-(
 

NorthSky

Major Contributor
Joined
Feb 28, 2016
Messages
4,998
Likes
944
Location
Canada West Coast/Vancouver Island/Victoria area
OP
svart-hvitt

svart-hvitt

Major Contributor
Joined
Aug 31, 2017
Messages
2,375
Likes
1,253

NorthSky

Major Contributor
Joined
Feb 28, 2016
Messages
4,998
Likes
944
Location
Canada West Coast/Vancouver Island/Victoria area
What measuring techniques do you recommend?
There are a variety of measuring techniques that are available today but some are more suited for measurements in recording studios and other relatively small room environments than others.

Summarized below are most of the commonly available techniques and some tips to ensure that you can make a reliable measurement with the tools that you have available:

  • 1/3rd Octave real time analyser (RTA)
Pink noise is played through the monitor and a typically in 1/3 octave bands, a graphical output waveform is displayed. The sound field in the room should become stable before conclusions are drawn about the measurement. This is a quick measurement technique suitable for subwoofer to monitor level balancing.

  • Spot frequency using sine wave and a sound level meter
A sine wave signal generator is used to drive the monitor and the sound level is measured using a sound level meter. This method measures the steady state conditions in the room which emphasizes the room resonances. This method is suitable for low frequency room resonance evaluation in highly damped rooms.

  • Warble tone spot frequency
This techniques is similar to the previous one, but uses a tone that has been slightly modulated to cover a wider frequency range.

  • Swept sine wave
The traditional swept sine wave measurement measures the instantaneous sound level while the sine frequency is sweeping though the audio band. This method is problematic as there are uncertainties in the settling time of the room response and the effects of possible system non-linearity (distortion) are not detectable.

  • Time Delay Spectrometry (TDS)
A sine sweep is used as the signal. A tracking filter minimizes noise in the measurement and selects a certain extent of the room response duration for the measurement. This is analogous to time windowing an impulse response. This method can suffer from a loss of accuracy at low frequencies (due to the tight 'time windowing') and the response is smoothed depending on the sweep speed and filter width.

  • FFT (Fast Fourier Transform) analysis based methods
Using FFT on an impulse measurement

This method measures the impulse response directly and then analyses the frequency response using Fourier
analysis on a recorded impulse. Impulses are generated mechanically or electronically. This method suffers from very poor signal to noise ratio in the measurement, and is therefore often impractical or inaccurate.

Using noise (or even music!)

This method uses a wide band statistically stationary random signal (noise) and continuous Fourier analysis. A large number of FFTs are averaged to calculate the frequency response. This method is very low and unreliable at low frequencies. Noise can be replaced with any wideband signal, but this does not improve the performance of the measurement method.

  • Maximum Length Sequence and FFT (MLS)
A maximum length sequence is a pseudorandom signal having noise-like spectral content, i.e. energy across the whole audio band, but with very high signal level as the method of generating the signal ensures that a high energy level is obtained at most audio frequencies during each measurement cycle. Using an MLS sequence and FFT analysis achieves much better signal-to-noise than using just noise, and taking a reliable measurement becomes fast. Using the MLS method only works for linear systems, and does not produce accurate results when the distortion is high.

  • Using a variable speed sine sweep and FFT
The sine sweep response can be FFT analysed to calculate estimates of the impulse response and frequency response. The speed of the sinusoidal can be adjusted during the sweep. This can adjust the energy density of the measurement signal, and allows higher energy density to be used where more signal-to-noise ratio is needed, for example at low frequencies. Using the FFT methods can also enable exclusion of the harmonic distortions, improving the quality of the measurement. Using the swept sine with exponentially increasing speed and FFT is considered the method to produce the best signal-to-noise of all methods at the moment. This method is also available widely in general purpose acoustical measurement tools in the Internet.
 

pirad

Active Member
Joined
Apr 22, 2018
Messages
178
Likes
61
Yes, Andrew Marshall believed in the. usefulness of measurements and did his own. Unfortunately, they were not always comprehensive, not revealing off-axis first reflection or sound power data that matters in rooms. The other Canadian magazines, AudioScene Canada and Sound Canada, paid for measurements and double-blind listening tests to be done at the National Research Council. That is history. Soundstage.com still publishes limited, but useful, anechoic data from my old NRCC lab.

Some US publications wanted to have such data for reviews but the cost and complications of shipping, customs, etc., getting products into and out of Canada in a timely manner, were big obstacles. It would have been interesting to see what might have evolved if that had happened. One of those publications went on to do only totally subjective reviews: no measurements, and uncontrolled, sighted, listening tests - opinions only. :-(

Dr Toole, what do you think of the method for measuring acoustic fields with linear robots?
The 3D raster of grid points can be quite dense.
 

Floyd Toole

Senior Member
Audio Luminary
Technical Expert
Industry Insider
Forum Donor
Joined
Mar 12, 2018
Messages
367
Likes
3,905
Dr Toole, what do you think of the method for measuring acoustic fields with linear robots?
The 3D raster of grid points can be quite dense.

What truly matters is the sound arriving at the listener's ears. Having a robot driven mic mapping out all three dimensions of a room is a nice academic exercise, having little or no relevance to sound reproduction in small rooms. Such a scheme might add information in professional venues with large audiences, but the current predictive modeling methods appear to be quite successful and much, much simpler.

If you read my book, I think you will understand that two ears and a brain are superb at separating loudspeakers from rooms at frequencies above 300-500 Hz. Understanding the loudspeaker is key. That is what data in my 1985-86 AES papers revealed, and that is a reason why the Genelec data shown in an adjacent post is so useful. There is enough of it to begin to anticipate how the speaker will sound in a room.

The standardized spinorama is a processed version of these and more data (70 individual frequency responses) aimed to be more directly revealing of in-room performance.

Most loudspeaker specs are an insult to our intelligence. These are not. Thanks to Ilpo; good for Genelec.
 

NorthSky

Major Contributor
Joined
Feb 28, 2016
Messages
4,998
Likes
944
Location
Canada West Coast/Vancouver Island/Victoria area
OP
svart-hvitt

svart-hvitt

Major Contributor
Joined
Aug 31, 2017
Messages
2,375
Likes
1,253
I met Ilpo sometime in the 80s at AES conventions. He had been following my NRCC research and papers and was eager to demonstrate to me how well he had applied the findings. Then, and in following years, when we met at AES conventions, he would proudly take to to his demo room and play classical music through his range of speakers, from small to large, demonstrating how similar, and good, they sounded. He had the courage to publish fundamentally accurate and useful anechoic data on his speakers - something almost nobody did or does. I liked him. He is a loss to the audio industry.

That said, I assume for business reasons, Genelec followed the guidance of ITU and EBU standards requiring flat steady state in-room curves, and they provide means to achieve it. This is demonstrably wrong, but Europeans have a commitment to "standards" that is substantially missing in our culture. Many broadcasters and recording studios were misguided by these standards. See Section 13.2.2 "The wrong room curve" in my new book. Summary: they require a flat on-axis anechoic response, and then, after installation, a flat in-room steady-state curve. One cannot have both, except in an anechoic room!

Nevertheless, for anyone willing to exercise a modicum of independent, logical, thought can use his products to generate fine sound.

@Floyd Toole , maybe my math/logic is faulty, but the «correct» curves of yours are for enjoying playback material. Right?

Would a «correct» curve look flat if we’re still in the «translation»/«distribution» phase of the production chain? If a mastering engineer applies the tilted curve when listening to the material, and masters based on this information, wouldn’t we have doubled-up with tilted curves when this material is played back at the position of the end customer?
 
Last edited:

Floyd Toole

Senior Member
Audio Luminary
Technical Expert
Industry Insider
Forum Donor
Joined
Mar 12, 2018
Messages
367
Likes
3,905
Professional music recording engineers have their favorite studio monitors among JBL, Dynaudio, Focal, Yamaha, Genelec, etc.


So long as they measure similarly and well, there is no problem. Loudspeaker design is a mature science, with similar-measuring loudspeakers sounding extremely similar. Unfortunately that is not a universal truth, and there remain remnants of the "bad old days" of highly colored monitor loudspeakers being used to create the recordings we listen to. If everyone had timbrally neutral loudspeakers we might have a chance of hearing what the artists created. Chapter 18 and other references in my book show horror-story examples of professionally "approved" monitor loudspeakers, as well as their consumer equivalents.

Fortunately the brands you name seem to agree on the general performance target. Others may differ. Consumer and pro loudspeakers have exactly the same problem.
 

Floyd Toole

Senior Member
Audio Luminary
Technical Expert
Industry Insider
Forum Donor
Joined
Mar 12, 2018
Messages
367
Likes
3,905
@Floyd Toole , maybe my math/logic is faulty, but the «correct» curves of yours are for enjoying playback material. Right?

Would a «correct» curve look flat if we’re still in the «translation» phase of the production chain? If a mastering engineer applies the tilted curve when listening to the material, and masters based on this information, wouldn’t we have doubled-up with tilted curves when this material is played back at the position of the end customer?

No. If the mixer and mastering engineer both listen to loudspeakers having flattish direct sound output and relatively uniform directivity, and we have similar loudspeakers at home it means that there is a reasonable chance of us all hearing the same sound quality/timbral balance. With the best monitor loudspeakers and the best consumer loudspeakers that is the situation. That eliminates the circle of confusion, unless, as discussed earlier in this thread, someone decides to invoke in-room EQ at mid and high frequencies (it is necessary at bass frequencies). The fact that the steady-state room curves in all of these cases will exhibit a gentle downward tilt is a product of the inherent directivity vs. frequency of the loudspeakers we use and the small, somewhat reflective, rooms within which we listen. The perceived sound should be very similar for all involved at all stages of the process. You must read my book - that is what it is all about.
 
OP
svart-hvitt

svart-hvitt

Major Contributor
Joined
Aug 31, 2017
Messages
2,375
Likes
1,253
No. If the mixer and mastering engineer both listen to loudspeakers having flattish direct sound output and relatively uniform directivity, and we have similar loudspeakers at home it means that there is a reasonable chance of us all hearing the same sound quality/timbral balance. With the best monitor loudspeakers and the best consumer loudspeakers that is the situation. That eliminates the circle of confusion, unless, as discussed earlier in this thread, someone decides to invoke in-room EQ at mid and high frequencies (it is necessary at bass frequencies). The fact that the steady-state room curves in all of these cases will exhibit a gentle downward tilt is a product of the inherent directivity vs. frequency of the loudspeakers we use and the small, somewhat reflective, rooms within which we listen. The perceived sound should be very similar for all involved at all stages of the process. You must read my book - that is what it is all about.

@Floyd Toole , did your measurements in the book register steady state response or direct sound?
 

Floyd Toole

Senior Member
Audio Luminary
Technical Expert
Industry Insider
Forum Donor
Joined
Mar 12, 2018
Messages
367
Likes
3,905
@Floyd Toole , did your measurements in the book register steady state response or direct sound?
In my book both direct and steady-state sound are shown, explained and discussed in considerable detail.

If you don't want to buy the book, the basics are explained in this open-access AES paper:
Toole, F. E. (2015). “The Measurement and Calibration of Sound Reproducing Systems”, J. Audio Eng. Soc., vol. 63, pp.512-541. This is an open-access paper available to non-members at www.aes.org. Just go to "publications" , "open access" and type in "Toole" - too lazy to get the link, sorry :)
 
OP
svart-hvitt

svart-hvitt

Major Contributor
Joined
Aug 31, 2017
Messages
2,375
Likes
1,253
No. If the mixer and mastering engineer both listen to loudspeakers having flattish direct sound output and relatively uniform directivity, and we have similar loudspeakers at home it means that there is a reasonable chance of us all hearing the same sound quality/timbral balance. With the best monitor loudspeakers and the best consumer loudspeakers that is the situation. That eliminates the circle of confusion, unless, as discussed earlier in this thread, someone decides to invoke in-room EQ at mid and high frequencies (it is necessary at bass frequencies). The fact that the steady-state room curves in all of these cases will exhibit a gentle downward tilt is a product of the inherent directivity vs. frequency of the loudspeakers we use and the small, somewhat reflective, rooms within which we listen. The perceived sound should be very similar for all involved at all stages of the process. You must read my book - that is what it is all about.

@Floyd Toole , I guess my point is this:

When I do research (not audio), definitions are of great importance in order to avoid confusion, error, inaccuracy etc. Of course, any researcher would agree on this.

When I look at your figures and curves (in your latest edition book) reflecting listener preferences, it seems like «steady state» is used in all (?) cases.

But what is exactly the definition of «steady state» (in for example your 2005 JAES article) ? Do all researchers use the same definition? Do all users of measuring equipment use the same definition?

Another concept is «direct sound». If direct sound and steady state are not the same, one cannot be certain that the steady state curve preferred by listeners is the same as the direct sound curve preferred by listeners.

Olive’s research (2009) article on DSP room compensation products didn’t investigate any DSP systems that use direct sound, did it? (I can’t find Olive’s definition of the sound he measured, if it’s steady state or direct sound).

So my reasoning goes like this:

1) Steady state needs to be clearly defined. Steady state defined by one researcher can be different from the steady state definition of another researcher. Which means that steady state measured data will have some inherent room for error if not otherwise controlled for.

2) If direct sound differs from steady state, one could argue that one has to investigate listeners’ preferences regarding direct sound. Has this ever been done?

Because modern gear can separate direct sound from reflections, it would be of interest to see how listeners’ preferences for both definitions of sound would look like as represented by a frequency curve.

So when we are talking about sound curves, do we need to separate steady state curves from direct sound curves?
 

Cosmik

Major Contributor
Joined
Apr 24, 2016
Messages
3,075
Likes
2,180
Location
UK
...one cannot be certain that the steady state curve preferred by listeners is the same as the direct sound curve preferred by listeners.
I think that what has been said earlier is that listeners don't actually prefer an in-room curve (which I think is what you are meaning by steady state i.e. not anechoic or gated to be anechoic). What they prefer is a neutral* speaker as measured anechoically regardless of whatever room it is placed in. This gives a resulting in-room steady-state curve that will be different for each type of room.

But if the speakers aren't neutral (very few if any are of course) there is an unresolved ambiguity about what the listener prefers. Thinking that it is 'the steady state in-room curve' is jumping to an unwarranted conclusion.

There may even be a correlation between apparent preferences and in-room curves, but thinking it is the curve that is causing the preference is a red herring.

*neutral meaning flat frequency response and uniform dispersion at all frequencies - but it can still be directional, not omni.
 

Floyd Toole

Senior Member
Audio Luminary
Technical Expert
Industry Insider
Forum Donor
Joined
Mar 12, 2018
Messages
367
Likes
3,905
When I do research (not audio), definitions are of great importance in order to avoid confusion, error, inaccuracy etc. Of course, any researcher would agree on this. Yes indeed!

When I look at your figures and curves (in your latest edition book) reflecting listener preferences, it seems like «steady state» is used in all (?) cases.
I cannot imagine where you got that idea. The very first experiments I ever published (1986, a selection of which are shown in Figure 5.2, were anechoic data. Listeners unambiguously preferred loudspeakers with flattish anechoic on-axis (direct sound) response. The spinorama data extensively shown in the book are anechoic data. I show in Figure 5.11, and elsewhere, how anechoic data can predict steady state in room curves with useful accuracy above the transition frequency. Starting with the 1986 results, listener preferences have correlated with loudspeakers radiating a flattish, smooth (no resonances) on-axis/listening window (a.k.a. direct sound) performance. Well behaved off-axis performance simply improves the score. As explained starting in Section 11.5 (p. 321) this relationship also extends to cinema-sized spaces. A flattish direct sound is the underlying requirement. Sean Olive's investigations (p. 137) of the relationship between listener preferences and measurements show that the direct sound is highly weighted in the factor analysis. Part Three of his exercise is particularly revealing, when listener descriptions of what they were hearing clearly relate to the direct sound. And on, and on . . . throughout the book.

But what is exactly the definition of «steady state» (in for example your 2005 JAES article) ? Do all researchers use the same definition? Do all users of measuring equipment use the same definition?
As the name implies, it is a measurement in which, after the onset of the test signal, the room sound is allowed to reach a "steady state" value, with no further changes with time. It is defined on p. 383. The time required for this to happen will depend on the reflectivity of the room, but it is normally reached in 200-300 ms. Figure 10.2 shows the relationship between reverberation time and a new metric called cumulative energy time. Obviously, the longest integration times are at low frequencies.

Another concept is «direct sound». If direct sound and steady state are not the same, one cannot be certain that the steady state curve preferred by listeners is the same as the direct sound curve preferred by listeners.
Only in a reflection free, anechoic, environment can the direct and steady-state sounds be the same. In normally reflective rooms, evidence is that one can be very certain which of the two is related to listener preferences.

Olive’s research (2009) article on DSP room compensation products didn’t investigate any DSP systems that use direct sound, did it? (I can’t find Olive’s definition of the sound he measured, if it’s steady state or direct sound).
They were "room curves", which are commonly steady state.

So my reasoning goes like this:

1) Steady state needs to be clearly defined. Steady state defined by one researcher can be different from the steady state definition of another researcher. Which means that steady state measured data will have some inherent room for error if not otherwise controlled for.
One cannot assume that all researchers and all measurement system manufacturers are equally competent, or well informed, so, yes, there is the possibility of misleading data. However, steady state is clearly defined by its name.

2) If direct sound differs from steady state, one could argue that one has to investigate listeners’ preferences regarding direct sound. Has this ever been done?
All research I have done, starting with the 1986 publication, separates anechoic and in-room measurements, and even in that early paper I noted that the anechoic "front hemisphere" spatial average was a good indicator of in-room steady state response. This topic turns up several times in the book, and Section 5.6 discusses addresses it specifically.

Because modern gear can separate direct sound from reflections, it would be of interest to see how listeners’ preferences for both definitions of sound would look like as represented by a frequency curve.
See responses above. It has been done.

So when we are talking about sound curves, do we need to separate steady state curves from direct sound curves?
Yes. Not to do so is irresponsible. Most people lean on steady-state curves because they are easy to measure. They have a historical bias because of the popularity of 1/3-octave Real Time Analyzers for several decades. Time windowed in-room measurements can usefully describe the direct sound at higher frequencies, but the short duration of a reflection-free time window results in insufficient frequency resolution at lower frequencies. Anechoic data is best, but not accessible to most people. Comprehensive, on and off axis, spatially combined as in spinorama, is extremely rare.
Expand the above to see my other comments - I assumed that they would all appear, but not so.
 
OP
svart-hvitt

svart-hvitt

Major Contributor
Joined
Aug 31, 2017
Messages
2,375
Likes
1,253
I think that what has been said earlier is that listeners don't actually prefer an in-room curve (which I think is what you are meaning by steady state i.e. not anechoic or gated to be anechoic). What they prefer is a neutral* speaker as measured anechoically regardless of whatever room it is placed in. This gives a resulting in-room steady-state curve that will be different for each type of room.

But if the speakers aren't neutral (very few if any are of course) there is an unresolved ambiguity about what the listener prefers. Thinking that it is 'the steady state in-room curve' is jumping to an unwarranted conclusion.

There may even be a correlation between apparent preferences and in-room curves, but thinking it is the curve that is causing the preference is a red herring.

*neutral meaning flat frequency response and uniform dispersion at all frequencies - but it can still be directional, not omni.

@Cosmik , instead of relying 100 percent on a first principle - which is in your case is "a flat speaker of low distortion is all you need" - I like to measure things to understand a bit more.

Genelec showed at the start of the millennium (see Mäkivirta and Anet: https://www.genelec.com/documents/publications/SurveyofMonitoringConditions.pdf) that a flat speaker may not be all there is to sound. So instead of a one-factor model - where the speaker is the only factor - they introduced the room as a new factor.

Since then, several "room correction" products were introduced.

In 2009, Olive writes: "The sonic benefits of these room correction products are generally not well known since, to my knowledge, no one has yet published the results of a well-controlled, double-blind listening test on room correction products" (source: http://seanolive.blogspot.no/2009/11/subjective-and-objective-evaluation-of.html ).

And he concludes that room compensation products are not equal. Some room compensation products improve sound, some harm the sound. And the uncompensated sound - the one factor model - outperforms in some cases and underperforms in other cases.

To conclude: Olive's research suggests that room compensation done right (and wrong!) deserves further investigation.

Regrettably, Olive doesn't define the measured sound. Is it steady state or is it direct sound? To my knowledge, Toole also uses the term "steady state" without defining it for other researchers to replicate and investigate his findings.

Say measured sound can be divided into two categories:

1) Direct sound (DS)
2) Steady-state (SS)

And, DS≠SS.

Further - and now I am on thin ice because audio is not my field - I assume the following:

SS=DS+R

where R is reflected sound.

Interestingly, in anechoic chamber, R is zero. So in free field - where there's only DS - the correct curve is flat, not tilted.

I don't know exactly how to define DS as opposed to sound in anechoic chamber sound (AS). What I assume, is that DS is an approximation to the sound in anechoic chamber (AS), however with some real-world complications. I assume the following:

AS=DS+P

where P is real-world problems (outside of anechoic chamber).

Modern measuring devices let us measure both DS and SS. Therefore, I would have liked to see how listeners' preferences may change if they are exposed to DS only or SS. I haven't seen research that look at listeners' curve preferences in both the DS and the SS case.

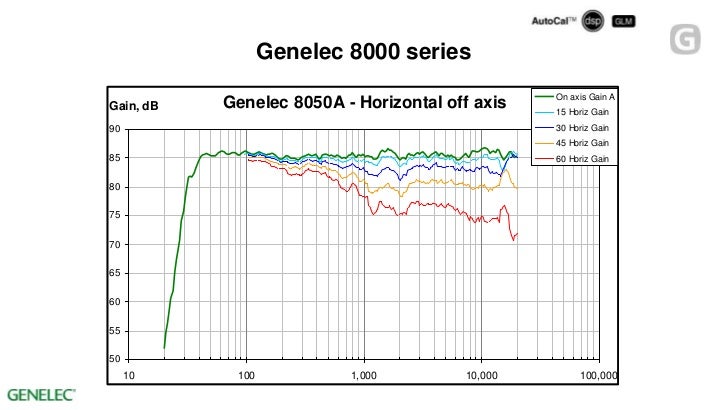
For Genelec it seems to be important to focus on both DS and SS. See the following publication:

https://www.genelec.com/sites/defau...gues/genelec_monitors_in-room_performance.pdf

They advice their customers on the use of their products; both the shortest distance from the monitors (due to the summing of drivers problem) and the critical distance (where DS still dominates). Source: https://www.genelec.com/sites/defau...gues/genelec_monitors_in-room_performance.pdf

According to Genelec, there is a critical distance where R has a higher sound than DS. Both minimum distance (minD) and critical distance critD can be calculated.

So what confuses me, is that I haven't seen Toole or Olive define exactly what they mean by SS; they haven't defined minD, critD and R of their audio setups. The magnitude of the curve tilting (in dB) could be depending on where the measurements where made; the higher R is, the more tilting of the curve.

In other words, if DS is an approximation to AS, and the listener is exposed to DS, the "correct curve" (CC) is the flat one. As R increases, it seems like the tilted curve is CC. Therefore CC is not a fixed variable; it depends on the relationship between DS, R and SS!

So let me hypothesize a bit:

1) If exposed to pure DS, CC is flat.
2) If exposed to "pure" SS, CC is tilted.
3) If exposed to a mix of DS and SS - i.e. where R is a factor but not dominating - CC is somewhere between flat and tilted (as per point 2 above).

A more intelligent algorithm would know about both (1) and (2) and give the user a dynamic mix based on measurements of both DS and SS.

To sum up:

=> In the 1980s, progressive speaker producers solved the problem of flat and low distortion. @Cosmik believes we are still here, but others were not so sure.
=> Around 2000 progressive speaker producers went from a one-factor model - where the speaker was the only factor - to a two-factor model where the room entered the equation.
=> Around 2005 progressive speaker producers went from a two-factor model - where the room was accounted for - to a three-factor model where the room was divided into both DS and SS (due to controlling for R).

So in order to optimize sound in the listening position, you'd need the following:

1) A flat speaker of low distortion.
2) Room compensation where both DS and SS are accounted for.
3) For reference listening, the listener needs to ensure he is exposed to primarily DS in order to avoid colourations by defining minD and critD.

As said, my field is not audio, so take my attempt at putting my confusions on paper with a fist of salt. Don't hesitate to point out where I'm "hearing voices in the air" ;)
 

Floyd Toole

Senior Member
Audio Luminary
Technical Expert
Industry Insider
Forum Donor
Joined
Mar 12, 2018
Messages
367
Likes
3,905
In addition to my earlier responses I can only add the following illustration - Figure 2.2 in the book. It attempts to convey the notion that two ears and a brain pay attention to acoustic variables - e.g. angle of incidence and timing of reflected sounds - that are totally ignored by omni-mic steady state measurements. Time windowing of such measurements alters which reflected sounds are included in the result, but takes no account of the angle of incidence. To human listeners this is the difference between possible coloration, and pleasant, absolutely normal, spaciousness when reflections arrive from directions different from the direct sound - which is the dominant situation. Chapter 7 discusses this in boring detail.

"room compensation" is an absolute requirement at low frequencies, and there are several options as explained in Chapters 8 and 9.

Everyone wants a single-curve solution. It is not possible.
 

Attachments

  • Figure 2.2 Not what we hear (small).jpg
    Figure 2.2 Not what we hear (small).jpg
    27.4 KB · Views: 326
Top Bottom