
VerticalLog
New Member
Greetings Audio Science-ers,
I recently jumped into amateur speaker design and building and have come seeking wisdom of the forum. I recently took on a project to build a sound reinforcement system for outdoor music+ events for a group with which I am involved. I have been doing extensive modelling of various drivers to appropriately match the system as a whole, but also have just been exploring. Anyhow, staring at all these graphs, especially when overlaid, has germinated some questions.
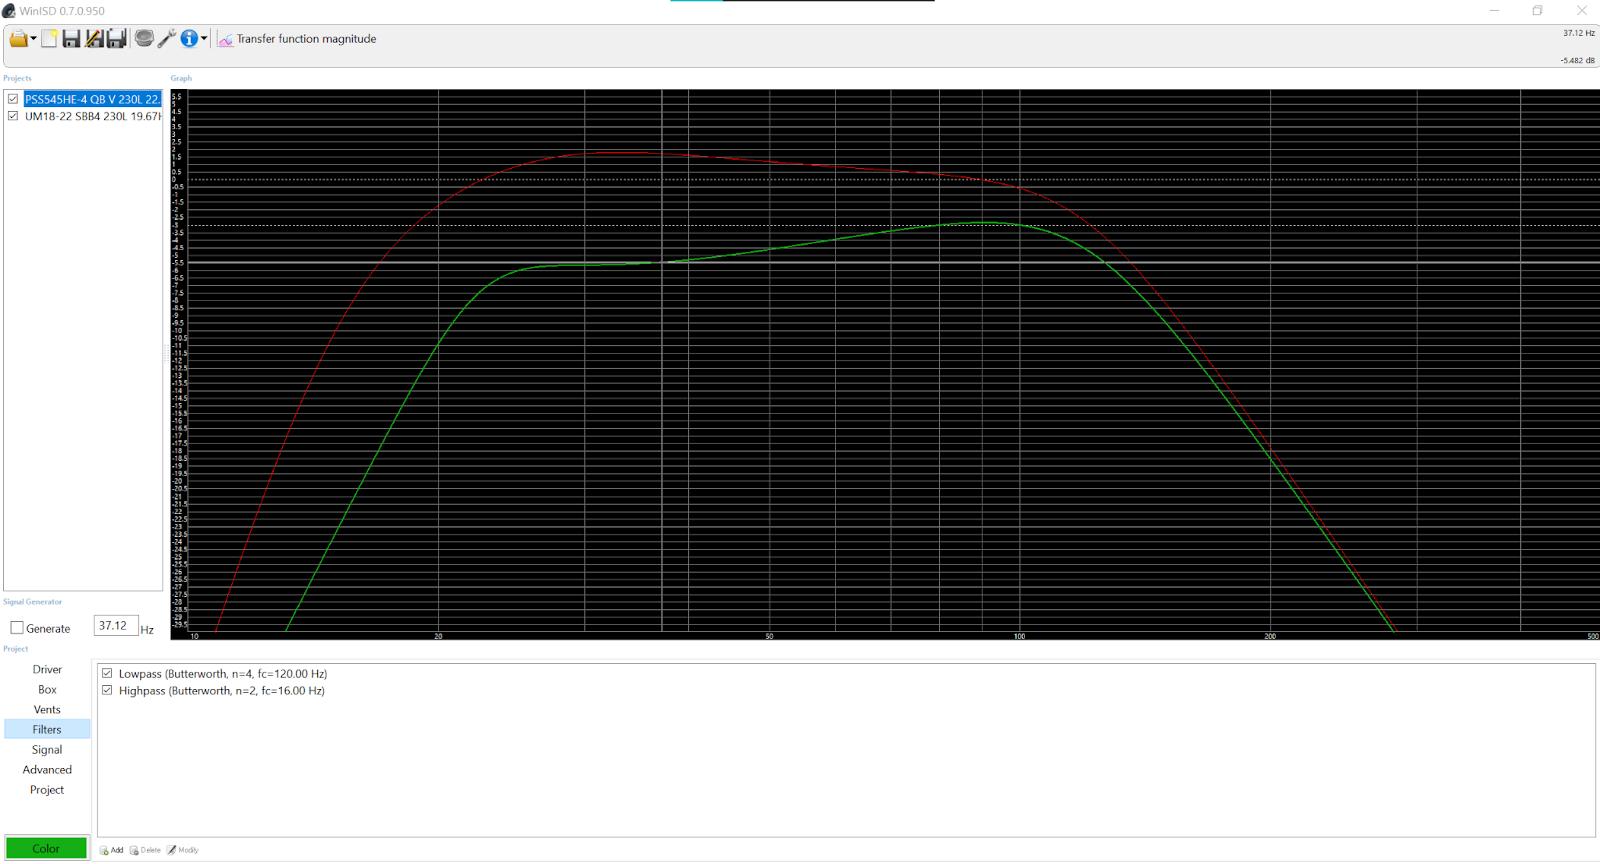
I have here overlaid two different subwoofer drivers. One is the Dayton Audio UM18-22 (red line) which is 18” nominal diameter and the other is a Dayton Audio PSS545HE-4 which is 21” nominal diameter.
For comparison, both are set in 230L ported enclosures and tuned to be about as flat as I could get them from ~20Hz to ~128Hz.
It is interesting to me that the UM18-22 curve sits above the 0dB line from about 22Hz to 90Hz while the larger PSS545HE-4 achieves a maximum of -3dB and has a large portion of the range sitting around -5.5dB. For curiosities sake I tried all sorts of difference enclosure volume and tuning frequencies. All sorts of curves can be made, but that driver pretty much always sits in the negative on the TFM graph unless it is in a very small box (90L) tuned at 49Hz, which gives a pretty narrow range of flat-ish frequencies (about 48Hz to 104Hz looking at -1dB to +2dB ).
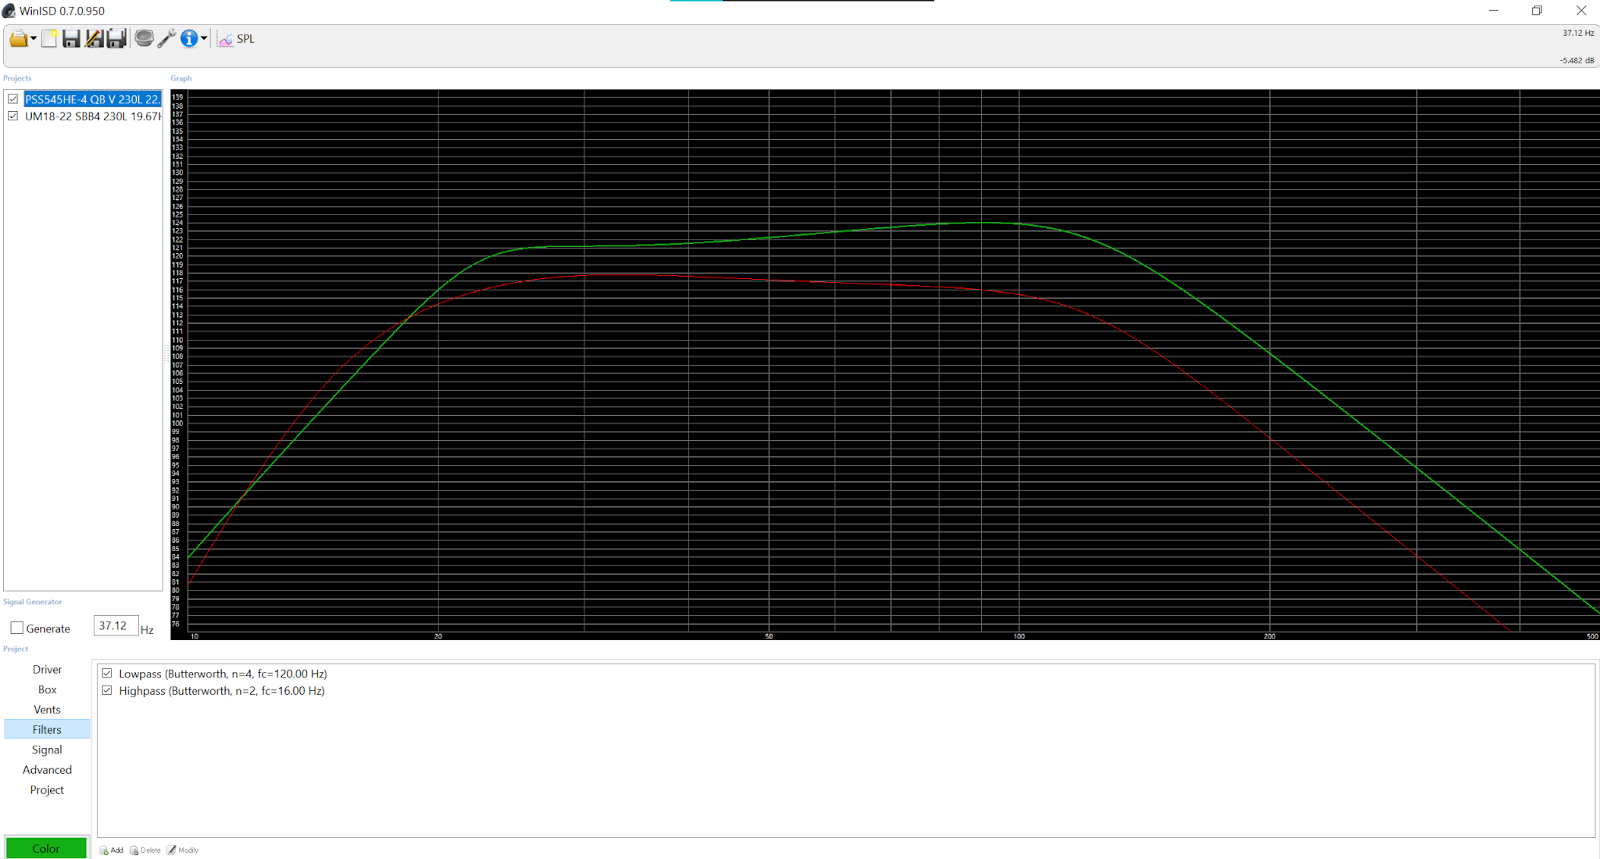
Of course the PSS454HE-4 is a 21” driver that will handle 1700W RMS, so the SPL graph shows it outperforming the smaller 1000W RMS driver in sound volume.
So, my question is either this or a topic in this direction: What does it mean that the PSS545HE-4 sits between -3 and -5dB on the transfer function magnitude graph and does it matter so long as the curve is satisfactorily flat and the SPL is acceptable?
This is mostly hypothetical. I may not build anything with either of these drivers.
Both drivers in 230L enclosures. Red is the 18"; Green is the 21". As an experiment, bumping the enclosure up to 1000L only marginally boosted the 25-30Hz range by about 1.5dB for the 21".
SPL with the same enclosure specs. It should be noted the 21" is 1700W RMS while the 18" is 'only' 1000W RMS. However, the 21"is 97dB verses 88dB for the 18" in sensitivity. Setting the "system input power" for the 21" driver to match at 1000W still puts its SPL curve higher across the entire band but more so in the higher frequency side of the range.
21" driver now set in a 90L box tuned to 47Hz to achieve some non-negative transfer function magnitude values.

I appreciate any insights you may have to offer.
I recently jumped into amateur speaker design and building and have come seeking wisdom of the forum. I recently took on a project to build a sound reinforcement system for outdoor music+ events for a group with which I am involved. I have been doing extensive modelling of various drivers to appropriately match the system as a whole, but also have just been exploring. Anyhow, staring at all these graphs, especially when overlaid, has germinated some questions.
I have here overlaid two different subwoofer drivers. One is the Dayton Audio UM18-22 (red line) which is 18” nominal diameter and the other is a Dayton Audio PSS545HE-4 which is 21” nominal diameter.
For comparison, both are set in 230L ported enclosures and tuned to be about as flat as I could get them from ~20Hz to ~128Hz.
It is interesting to me that the UM18-22 curve sits above the 0dB line from about 22Hz to 90Hz while the larger PSS545HE-4 achieves a maximum of -3dB and has a large portion of the range sitting around -5.5dB. For curiosities sake I tried all sorts of difference enclosure volume and tuning frequencies. All sorts of curves can be made, but that driver pretty much always sits in the negative on the TFM graph unless it is in a very small box (90L) tuned at 49Hz, which gives a pretty narrow range of flat-ish frequencies (about 48Hz to 104Hz looking at -1dB to +2dB ).
Of course the PSS454HE-4 is a 21” driver that will handle 1700W RMS, so the SPL graph shows it outperforming the smaller 1000W RMS driver in sound volume.
So, my question is either this or a topic in this direction: What does it mean that the PSS545HE-4 sits between -3 and -5dB on the transfer function magnitude graph and does it matter so long as the curve is satisfactorily flat and the SPL is acceptable?
This is mostly hypothetical. I may not build anything with either of these drivers.
Both drivers in 230L enclosures. Red is the 18"; Green is the 21". As an experiment, bumping the enclosure up to 1000L only marginally boosted the 25-30Hz range by about 1.5dB for the 21".
SPL with the same enclosure specs. It should be noted the 21" is 1700W RMS while the 18" is 'only' 1000W RMS. However, the 21"is 97dB verses 88dB for the 18" in sensitivity. Setting the "system input power" for the 21" driver to match at 1000W still puts its SPL curve higher across the entire band but more so in the higher frequency side of the range.
21" driver now set in a 90L box tuned to 47Hz to achieve some non-negative transfer function magnitude values.
I appreciate any insights you may have to offer.