• WANTED: Happy members who like to discuss audio and other topics related to our interest. Desire to learn and share knowledge of science required. There are many reviews of audio hardware and expert members to help answer your questions. Click here to have your audio equipment measured for free!

Exploration of data provided by vendors

kyle_neuron

Active Member
Joined
Jun 18, 2021
Messages
149
Likes
254
It doesn't cost much to generate all angles. I will check if the generated data is different aka freq response at 10 deg with precision set to 2.5, 5 or 10.
That would be interesting. I don’t think there’s likely to be a significant benefit to exporting the data using a more dense angular resolution than every ten degrees on the main horizontal and vertical axes to generate your Spinorama plots. It’s only in relation to the process of calculating the balloon from the data stored within the GLL.

In many cases, the speaker was likely measured using 5-degree reduction as this is commonly considered to be ‘good enough’ for the majority of more simple two-way or three-way point source style boxes.

However, for the purposes of scripting an automation which applies to all speakers with zero or minimal user-input before each each run, it’s best to go as high as possible. My laptop uses a four-year old ultraportable class CPU and still manages to breeze through a balloon calculation in around 30 seconds using the 2.5-degree resolution setting in GLL Viewer.
Note that the spinorama has not been designed for this kind of speakers. It doesn't even take phase into consideration only frequency data.
That’s no problem, so long as GLL Viewer is taking the phase into account when extrapolating the response to an arbitrary distance in space, which it does.

The choice & verification of suitable angular and frequency resolution data is a problem for the person capturing the data used to create the GLL balloon file is complex in the first place.

If we can trust that has been done properly, then there’s no issue to use only the magnitude response for generating a Spinorama plot.
I didn't know this two and will read them. But it is clear that phase is important when combining sources since that would be the case for 2 functions of complex numbers.
It absolutely is, and this is crucial when considering a major benefit of the GLL data type in comparison to AFMG’s older (and more readable) SPK format.

A GLL can contain high-resolution complex data for each individual radiating source within a given loudspeaker "box" or "cluster" and then combine them with arbitrary filtering to produce a response at any position in 3D space for any combination of those sources.

Tools like VituixCAD now offer this on the primary two axes for free, but this complex multi-source modelling method was seriously impressive stuff 15 years ago!

Agreed. Estimated max SPL is important for venues but for this forum, I am not sure that's super relevant. People always want bigger and louder but they are more
in the 120 dB SPL max why PA speakers are more 130+. If I can generate a max SPL curve for a given % of distorsion that would be nice.
I think the M-Noise/AES2022 testing process documentation might include some data on the correlation between THD and the stop condition thresholds for coherence & magnitude deviation, but it's not explicitly logged as part of those tests or the MIV one due to the use of steady-state noise stimuli, sadly.
the metadata file have the information.
I looked through the metadata file but hadn't swapped to the develop channel at that time, as I wasn't aware the live publicly-accessible site was pulling data from there instead of the default master channel of the repository.

It would still be nice to show the provenance on the website page if possible. I think quite a few folk may find the spin plots via Google searching, as I did, and not know where the information came from.
Thanks for the detailed answer. I wish there was a published API to the GLL file format.

You & me both, and I presume many others. AFMG probably wouldn't sell so many €4000 licenses for EASE software if their file format and tools worked with open-source acoustic modelling tools such as i-Simpa, though :)

Many manufacturers also provide their data as CLF files, which is a more open standard. AFMG SpeakerLab will export CLF data at the same time as generating the GLL. It looks like the Klippel NFS generates CLF, too. There are also lots of speakers with CLF data for download right on the CLF Grouo website, as well as the individual manufacturer’s own websites.

The format has lower angular & frequency resolution than GLL files can handle, and third-octave smoothed magnitude probably isn't sufficient to assess anything more than general trends in a Spinorama:
CLF v1 supports two data resolutions. A CLF Type 1 file contains Octave/10 degree data, a CLF Type 2 file contains Third Octave/5 degree data. Two resolutions are used to support legacy data that is only available in the lower resolution format. Authors are encouraged to publish data in the 'as measured' format so that end users know what they are using.

CLF2 v2 supports optional phase, filters and multipart files (for modeling multi-way loudspeakers and improved array modeling)
That said, CLFv2 is seen as 'good enough' for ODEON room acoustics modelling software, which is used for concert halls, stadia and the like.
You need to contact the CLF Group to obtain permission to use the compiled binary files in your own software, but that might be worth doing if it can expand your database while avoiding more GUI-scraping http://clfgroup.org/

There's also the Spatially Oriented Format for Acoustics aka SOFA standard. That is actually open-source, and the conventions can accurately describe sources & receivers with lots of detail. It's seen widespread industry adoption for storing and distributing things like binaural HRTF data, but the loudspeaker directivity convention hasn't seen the same level of uptake despite appearing to be comprehensive:

Which is a shame, because it doesn't seem like it would be too difficult to generate a SOFA FFD-TF file if a manufacturer or testing lab still has the original measurement IRs & associated metadata. There's even a nice little balloon data viewer application available on their wiki, and the data can be easily pulled out of the SOFA database for use in other stuff.

It might be a useful method to store your own data sets in a common format, though. Fewer folders full of ASCII data to sync with GitHub.
 
Last edited:
OP
P

pierre

Addicted to Fun and Learning
Forum Donor
Joined
Jul 1, 2017
Messages
963
Likes
3,052
Location
Switzerland
Hi Pierre! Is there any way to calculate the preference score based on the suite of measurements used by James Larsen in his reviews at Audioholics? He has reviewed some tower speakers where the measurements look very good, such as the BMR Towers and the Def Tech Demand D15 Towers, it would be interesting to see the preference scores for those and other towers reviewed there I think.

@Alfa1 I think James does not do the 72 measurements required to compute a spinorama or a preference score. His data are also not valid below 400Hz. So short answer is no. If he is willing to send the data to me, I can add them to the database and then you can make comparison with other speakers.
 

Alfa1

Member
Joined
Jun 29, 2021
Messages
5
Likes
7
@Alfa1 I think James does not do the 72 measurements required to compute a spinorama or a preference score. His data are also not valid below 400Hz. So short answer is no. If he is willing to send the data to me, I can add them to the database and then you can make comparison with other speakers.
Thanks, that is what I figured
 
OP
P

pierre

Addicted to Fun and Learning
Forum Donor
Joined
Jul 1, 2017
Messages
963
Likes
3,052
Location
Switzerland
I shared these results with the owner at Alcons, apparently you have been using the default settings.

"
Yes, not too bad.

However, they use the GLL data with the default settings: Info at 100m with air-absorption “on” and then the QRP20 has all of a sudden 6dB less top high.


Other than that, “not too bad”. J

What happens if you turn the air-absorption settings to OFF and set it at 6 meters instead Pierre?

I did set all gll files with:
- 10m
- angular resolution 2.5 degree
- air absorbtion off

They are some differences but not in the 6dB of magnitude order. Here is an example with the Meyer X40:
newplot (4).png


and with the QRP20:

newplot (5).png
 
Last edited:

CINERAMAX

Member
Dealer
Joined
Dec 3, 2022
Messages
52
Likes
39
Location
Miami
Hello Pierre, here is an exciting new Alcons Speaker with both commercial and residential potential.
324441683_1232872953984896_6470260529530604419_n.jpg

The QRP40/90 is a 2-way point-source column system with high-Q directivity for increased projection control. It is to be used as vertical sound system, for both permanent and portable applications. Its slim design packs a 1:1 non-compressed linear sound reproduction, with up to 90% less distortion.
For more information: https://tinyurl.com/QRP40-at-ISE

Here is the gll. file download.https://www.alconsaudio.com/GLL/QRP40-V1_0.zip?x12614

Pierre it would be awesome if you generate a spinorama for this one. Merci!!
 

Attachments

  • Alcons-QRP40-90-tech-spec.pdf
    133.3 KB · Views: 41

CINERAMAX

Member
Dealer
Joined
Dec 3, 2022
Messages
52
Likes
39
Location
Miami
Bumping the request as the directivity index of this model should be higher than in the QRP-20 as this is a vertical 2x5 1x12 2x5 D'appolito, not asymmetric as the qrp-20 was intended to be augmented with a lower bass extension module. This never materialized.

The designer explains:

"Philip “Dr. Phil” de Haan: “Initial plan of the QRP columns was to develop only the QRP20 and offer a low-mid frequency extension column, just as we have in the QR24 with the modular QM24. However, in the prototyping and simulation stages, we found that the directivity control of such a modular asymmetric approach was poor. So instead we decided to develop a dedicated, larger symmetrical system for more throw and SPL capability, with the excellent projection control characteristics the Q-series is known for.”
 

hege

Senior Member
Forum Donor
Joined
Dec 25, 2018
Messages
466
Likes
821
Location
Finland
Possible to add HK Audio?

Linear 7 115 FA model looks interesting. This series even has a separate fully eq'able DSP Out which I haven't seen anywhere else (I believe JBL PRX 9 only has basic HPF settings for a sub out). There's vague streaming abilities too, though AVB/Milan is hard/expensive to use at home..

 
OP
P

pierre

Addicted to Fun and Learning
Forum Donor
Joined
Jul 1, 2017
Messages
963
Likes
3,052
Location
Switzerland
Possible to add HK Audio?

Linear 7 115 FA model looks interesting. This series even has a separate fully eq'able DSP Out which I haven't seen anywhere else (I believe JBL PRX 9 only has basic HPF settings for a sub out). There's vague streaming abilities too, though AVB/Milan is hard/expensive to use at home..

yes but in a few weeks. More and more PA speakers have a full DSP onboard with a mix of IIR and FIR.
 
OP
P

pierre

Addicted to Fun and Learning
Forum Donor
Joined
Jul 1, 2017
Messages
963
Likes
3,052
Location
Switzerland
yes but in a few weeks. More and more PA speakers have a full DSP onboard with a mix of IIR and FIR.

Here they are:

  • HK Audio Linear 5 (112 F, FA, X, XA)
  • HK Audio Linear 7 (110 XA, 112 XA & FA, 115FA)
  • HK Audio Linear 9 (110 XA and 112 XA)

Remember that this things are designed to be eq-ed and directivity is more important that flatness out of the box.
The measurements are from the vendor and may or may not be consistent.

If you see a A in the name, that's for active.
110, 112, 115 => 1x 10, 12, 15 inch

SPL max is around 125-130 continuous. You need a subwoofer with most if not all of them.

Not bad at all and the price is really good.
 

ernestcarl

Major Contributor
Joined
Sep 4, 2019
Messages
3,110
Likes
2,327
Location
Canada
Hi, Pierre!

Can you also please include Fulcrum Acoustic's smallest models in the spin database: the RX599 and RX699. I'm primarily interested in the latter, though. Eventually gonna be using it as an upgrade for my current "center fill" monitor.

Hmmmn... I'm thinking some of the smallest PA models can be a lot easier (and also more aethetically acceptable) to integrate/hide in domestic indoor spaces.


----

I don't want to purchase a PA DSP amp, so I'm going to try my hand at self EQing this monitor.

1682282313357.png


1682282325685.png


*The more data points I have to compare with, the better!
 
Last edited:

dasdoing

Major Contributor
Joined
May 20, 2020
Messages
4,277
Likes
2,748
Location
Salvador-Bahia-Brasil
OP
P

pierre

Addicted to Fun and Learning
Forum Donor
Joined
Jul 1, 2017
Messages
963
Likes
3,052
Location
Switzerland
Hi, Pierre!

Can you also please include Fulcrum Acoustic's smallest models in the spin database: the RX599 and RX699. I'm primarily interested in the latter, though. Eventually gonna be using it as an upgrade for my current "center fill" monitor.

Hmmmn... I'm thinking some of the smallest PA models can be a lot easier (and also more aethetically acceptable) to integrate/hide in domestic indoor spaces.


----

I don't want to purchase a PA DSP amp, so I'm going to try my hand at self EQing this monitor.

View attachment 281074View attachment 281075


*The more data points I have to compare with, the better!

Hi Ernest (@ernestcarl ),

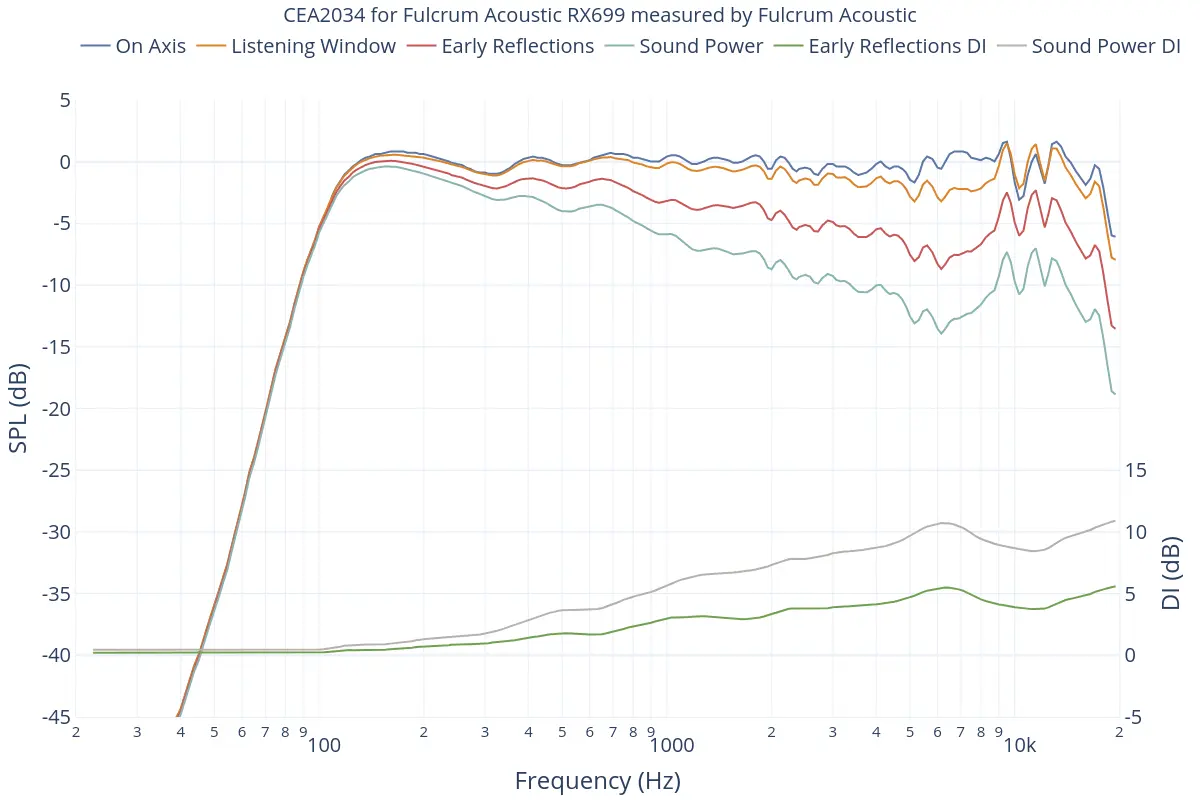
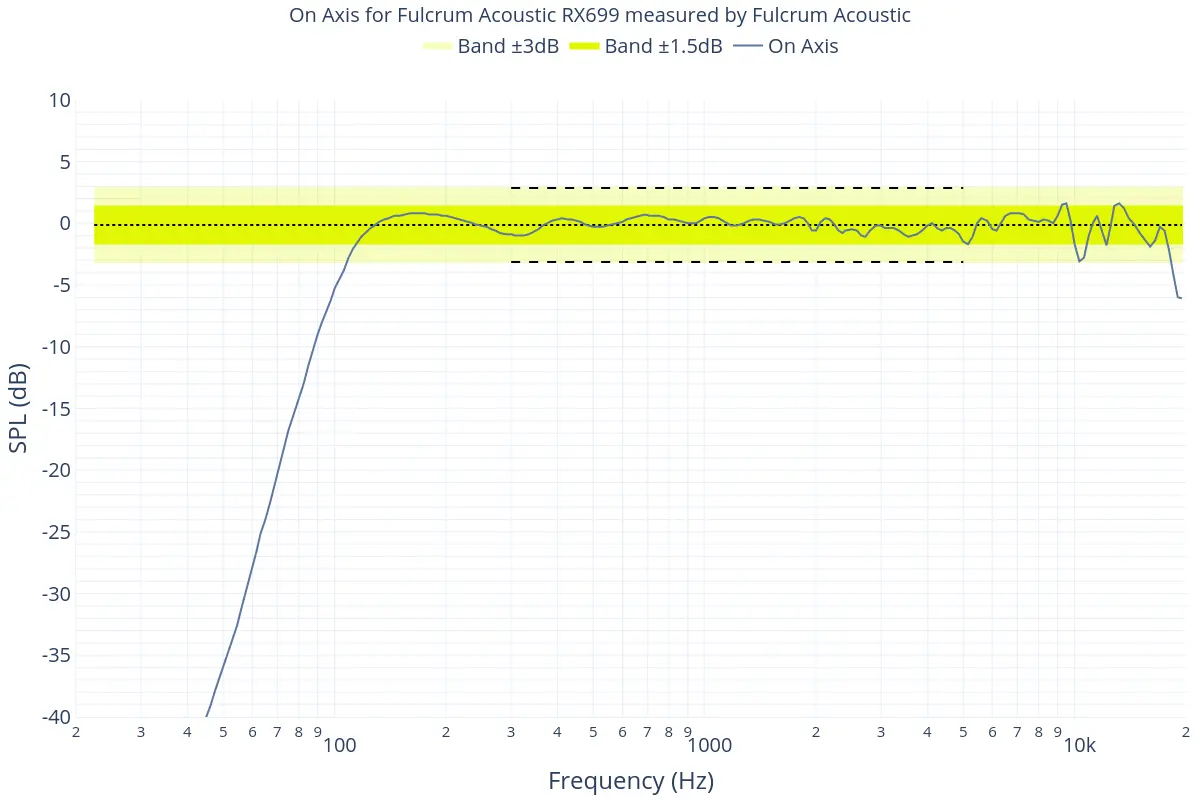
here is the spin derived from the GLL file they provide for RX699. It is obviously the corrected version. The on-axis shows some smoothing but
the filter did a great job.
CEA2034.webp
On%20Axis.webp

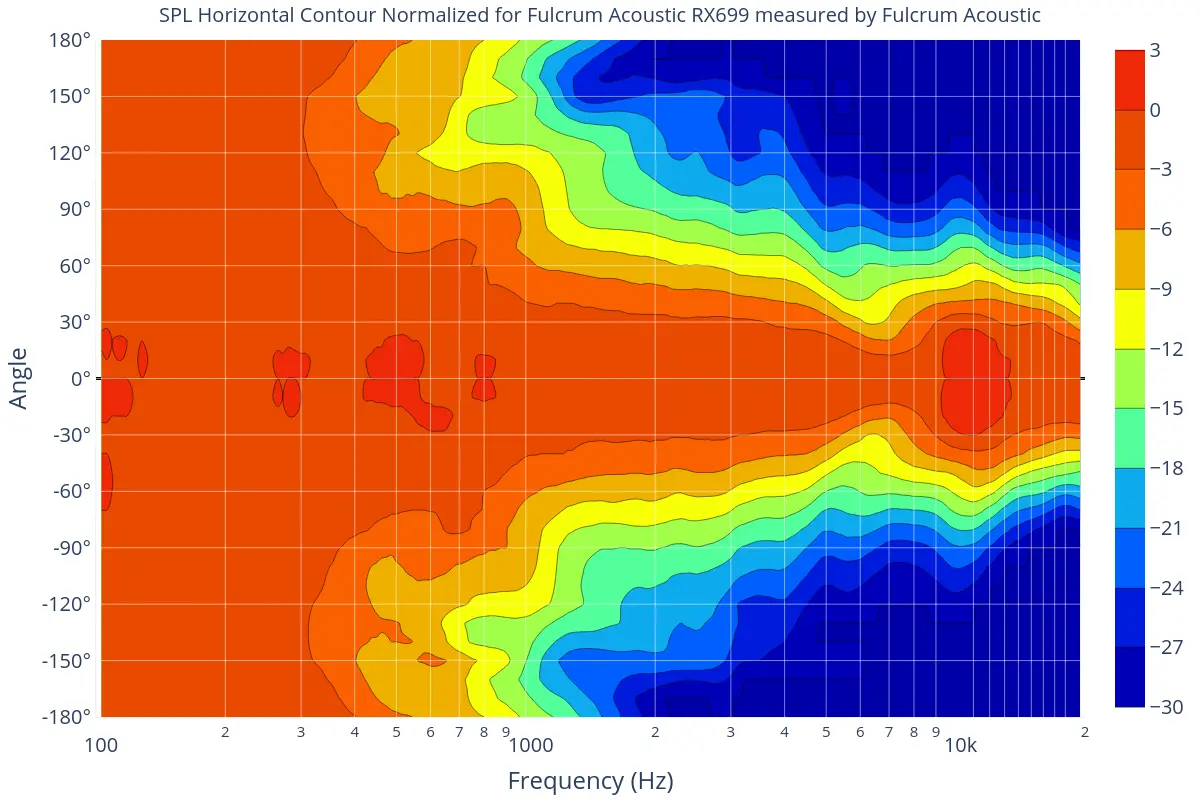
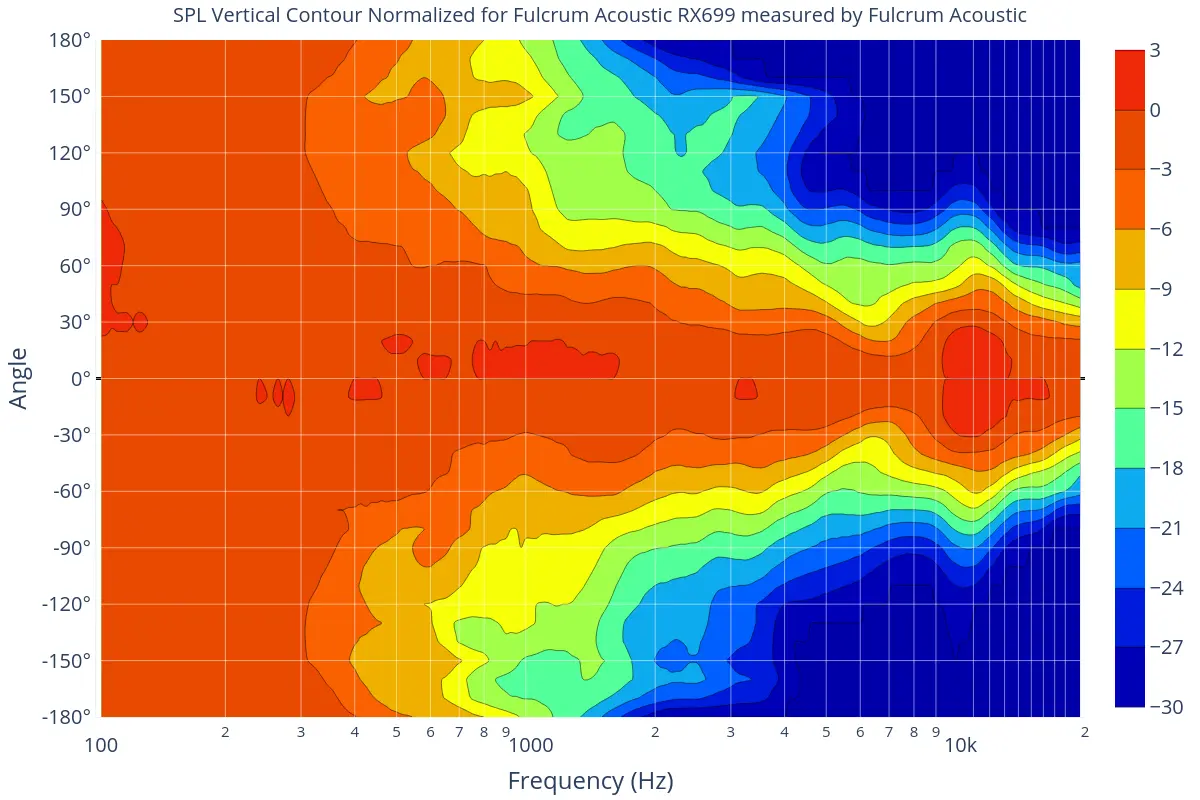
Contour plots are nice so coaxial is worth it:
SPL%20Horizontal%20Contour%20Normalized.webp
SPL%20Vertical%20Contour%20Normalized.webp


Since the directivity has errors at 6k and 10k, if you optimise for a flat PIR you get a less good LW and ON (left without EQ, right with it)
filters_lw_noeq.webp
filters_lw_auto.webp


Globally good but it will be expensive for what it does. It depends if you need the high output or not.
 
OP
P

pierre

Addicted to Fun and Learning
Forum Donor
Joined
Jul 1, 2017
Messages
963
Likes
3,052
Location
Switzerland
can I suggest the inclusion of two intresting brazilian PA speakers?

View attachment 281096
Hi @dasdoing,

this one is not that good (or not that different from other PA point source).
For the VSH206:

CEA2034.webp

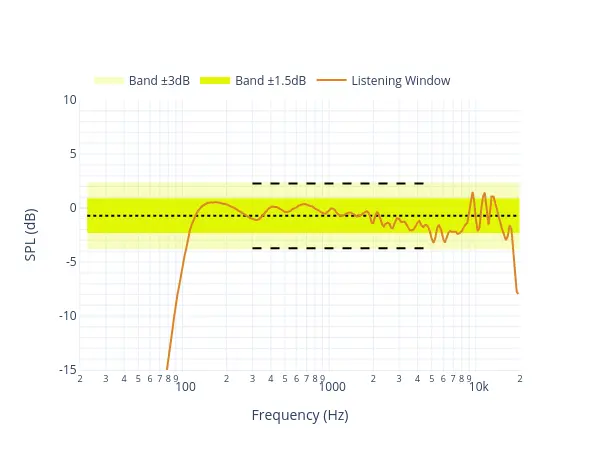
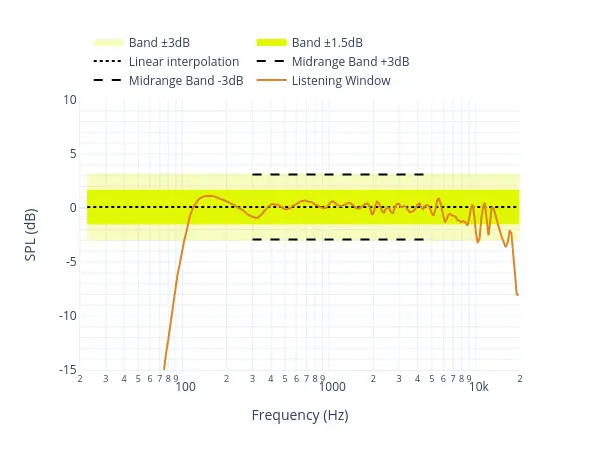
For the VSL206 + a subwoofer (I used their data, it looks like they didn't bother with a proper crossover) but it shows some potential:
CEA2034.webp

The cancellation at 100 Hz should disappear with a proper crossover.
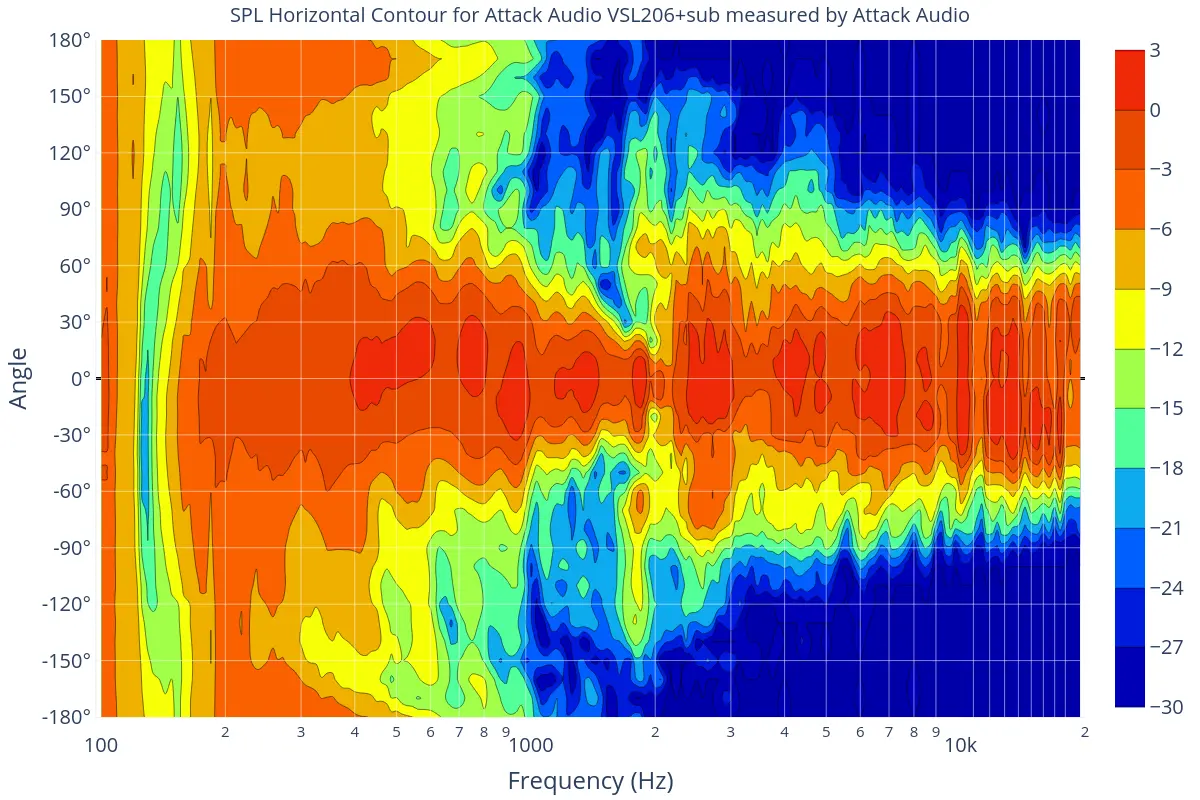
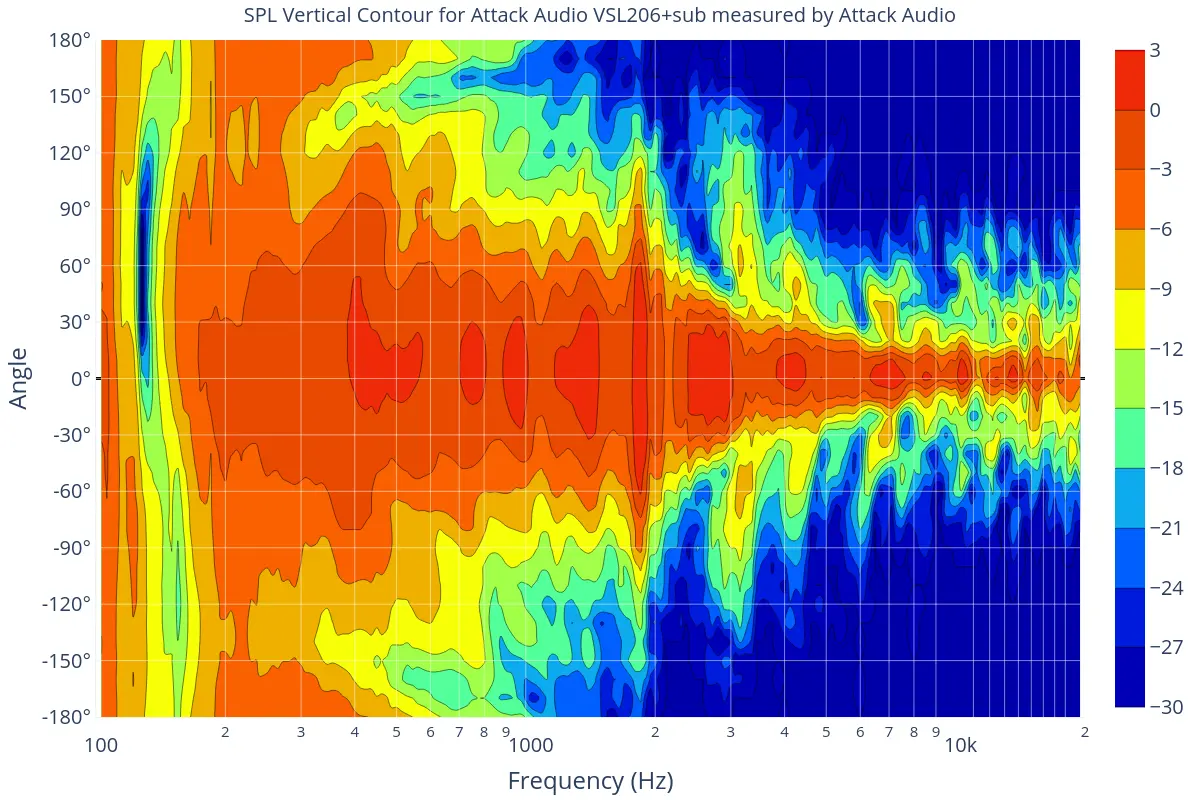
Directivity is typical of line arrays with only 1 sub and 1 speaker; if you want more vertical coverage, add a few speakers.
SPL%20Horizontal%20Contour.webp
SPL%20Vertical%20Contour.webp
 

ernestcarl

Major Contributor
Joined
Sep 4, 2019
Messages
3,110
Likes
2,327
Location
Canada
Hi Ernest (@ernestcarl ),

here is the spin derived from the GLL file they provide for RX699. It is obviously the corrected version. The on-axis shows some smoothing but
the filter did a great job.
CEA2034.webp
On%20Axis.webp

Contour plots are nice so coaxial is worth it:
SPL%20Horizontal%20Contour%20Normalized.webp
SPL%20Vertical%20Contour%20Normalized.webp


Since the directivity has errors at 6k and 10k, if you optimise for a flat PIR you get a less good LW and ON (left without EQ, right with it)
filters_lw_noeq.webp
filters_lw_auto.webp


Globally good but it will be expensive for what it does. It depends if you need the high output or not.

Thanks!

I’m treating this more as a personal experiment in equalizing a “simple” coax with horn waveguide unit. It’s also simple in that at least I don’t have to create the passive xo and build the box myself. I got one for just little over $300 — I reckon about half the price if bought new. The amp is going to cost more though…

Looking at the plots, I’m sure this is not going to be much worse than my dinky little single driver Fostex 6301. But with this PA unit, I can play it out the deck and backyard at way louder SPLs than I ever could with my poor little clipping/distorting 6301. Should be enough to satisfy me.
 

dasdoing

Major Contributor
Joined
May 20, 2020
Messages
4,277
Likes
2,748
Location
Salvador-Bahia-Brasil
Hi @dasdoing,

this one is not that good (or not that different from other PA point source).
For the VSH206:

CEA2034.webp

For the VSL206 + a subwoofer (I used their data, it looks like they didn't bother with a proper crossover) but it shows some potential:
CEA2034.webp

The cancellation at 100 Hz should disappear with a proper crossover.
Directivity is typical of line arrays with only 1 sub and 1 speaker; if you want more vertical coverage, add a few speakers.
SPL%20Horizontal%20Contour.webp
SPL%20Vertical%20Contour.webp

their meassuring room looks a little problematic

1682504745177.png


as shown here https://www.attack.com.br/repositorio/artigos-tecnicos/como-medimos-nosso-spl.pdf

I wonder how the horizontal is so much worse than what they provided here https://www.attack.com.br/repositorio/manuais-setups/vsh206/manual-tecnico-vsh206.pdf

it is 1/3 smoothed (as they indicate)....but still
 

ernestcarl

Major Contributor
Joined
Sep 4, 2019
Messages
3,110
Likes
2,327
Location
Canada
their meassuring room looks a little problematic

View attachment 281545

as shown here https://www.attack.com.br/repositorio/artigos-tecnicos/como-medimos-nosso-spl.pdf

I wonder how the horizontal is so much worse than what they provided here https://www.attack.com.br/repositorio/manuais-setups/vsh206/manual-tecnico-vsh206.pdf

it is 1/3 smoothed (as they indicate)....but still

Hmmmn… Their clio graph scale lettering kind of looks squished so… it’s like “double flattened”. I have seen smaart live measurements of the RX699 by Timo at 1-4 meters (but) ground plane and it matches the spec sheets pretty well. So I know Fulcrum’s spec sheet graphs (while indeed smoothed) are more realistic as per manufacturer spec sheets go.

*Unfortunately, very few publish off-axis curves.
 
Top Bottom