Are the ML's really directionally limited? As dipoles, they radiate to the back as much as to the front, it seems to me, which will introduce a different set of comb cancellations.
But I want to go back to the OP. Thank you! I had not yet really gotten around to grasping what was being shown on the decay plot, even at low frequencies where room modes may be dominant. It has explained what was confusing me about my measurements from a few days ago.
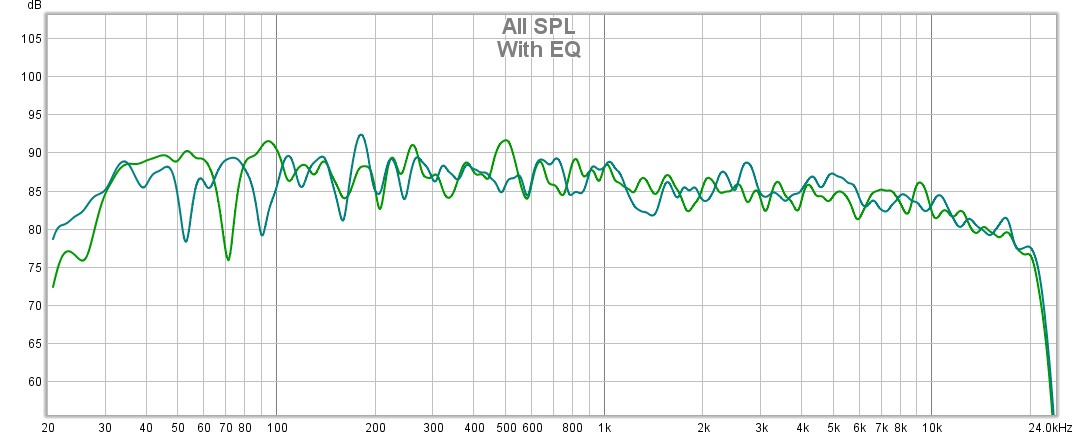
Here's a reminder of the frequency response plots from my Revel F12's in my room, with external equalization:
I've been trying to figure out the difference in nulls between the left and right speakers in the context of either room modes or boundary cancellations, but could not find corresponding measurements that made any sense. The room is geometrically complex, with openings to adjacent spaces and a sloped ceiling that eliminates first reflections from above and opens into a loft space. This seemed to defy any reasonable application of any simulators I have access to.
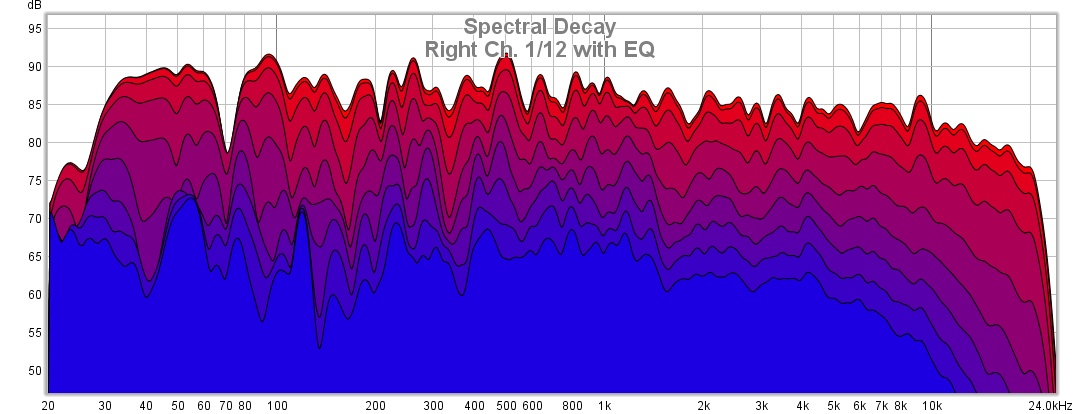
But in addition to validating the controlled directivity of my Revel F12's, the decay diagrams reveal the underlying room modes not visible in the immediate frequency response.
First, what I learned from the OP is that the frequency response at various times from the onset of sound affect our perception of it. The F12's in my room maintain reasonably flat response at 20ms intervals from the impulse from about 100 Hz up, until the high treble when it smoothly dies away. That explains why these speakers are so good at imaging in the room, and why they still sound really good outside the listening position (even if the phantom image loses focus). Here's how I think of it: They don't leave a timbral aftertaste.
But in the lower frequencies, the delay plot reveals all. I noticed a deep null in the right speaker at 71 or 72 Hz. The right speaker has an opposing wall that is a bit different in shape (and closer) than the left speaker, and I kept trying to make that explain the issue. But when I loot at that wall from the speaker, there's just too much furniture and "stuff" to provide that level of cancellation, and the 9-foot distance doesn't correspond to the frequency usefully. A null should appear at 1/4, 3/4, or 5/4 of the wavelength. The wavelength of 72 Hz is about 15.6 feet, so I was looking for 4 or 12-foot distances (everything else seeming to me much longer and not relevant). I was looking for the short distance because I did NOT see the null in the left channel at 72 Hz, and so thought the issue in the right channel must be close to the right speaker.
But with the decay plot, I see that the left channel does indeed have a null at 72 Hz, but something fills it in for the first tenth of a second.
I see the same effect at 90-something Hz, which shows as a null in the left channel, and also in the right channel but only after a tenth of a second or so.
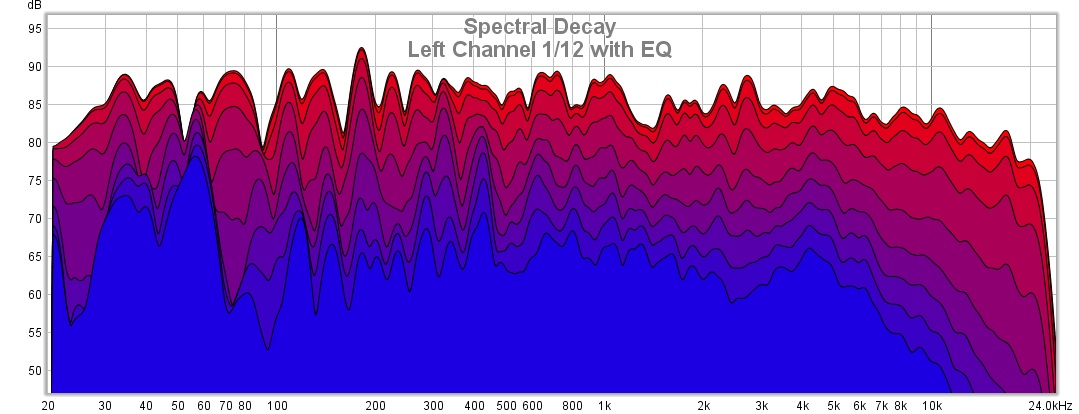
I also see that the left channel rings at 58 Hz, but it was lost in the dip at 52 Hz and the right channel didn't reveal it in the immediate frequency response. But the decay plot shows clear residual ringing in BOTH channels at 58 Hz. So, what distances will ring at 58 Hz? A little over 19 feet (as it happens, the effective bugle length of a Bb contrabass tuba). Yes, that means the second-harmonic "low" Bb of a Bb tuba is at 58 Hz, and I do hear that note ring in the room.
What causes it? Parallel walls side to side that are 19.5 feet apart. They will reinforce that frequency at the walls and right in the middle, which is about where the left speaker is relative to that dimension. Thus, the left speaker will excite that mode strongly and immediately, while the right speaker will excite it...eventually.
And what of the null at 72 Hz, that the right channel sees immediately but the left channel only sees eventually? Five-fourths of that 15.6-foot wavelength is, you guessed it, 19.5 feet. So, those parallel walls are ringing at 58 Hz, most immediately at the location of the left speaker, and nulling at 72 Hz, most immediately at the location of the right speaker. The room simulators turn out to be useful after all--at least the ones that show the nulls.
(The ringing at 120 Hz is the air-handling system.)
I would not have figured any of that out without the delay plot. Thanks for explaining it enough that I started really paying attention to it.
(Sidebar: The ringing in the range of the tuba interests me especially. I notice that some of the ringing seems to change pitch as it decays--some component decays faster leaving another component that isn't quite at the same frequency. I have noticed that some notes on the tuba do not sound in tune to me, but measure perfectly on a tuner, and sound fine played the usual way in other settings. I had wondered for some years whether that was some trick of the room acoustics or my tin ear, and here I see that it is the room after all. The fundamentals of the basic range of the tuba extend from 29 to 350 Hz for advanced players, but the sound includes prominent overtones up to the 9th harmonic. That 100-300Hz range is really important. I'm hearing the after-ring with a pitch slightly different from what I was producing, but the tuba pitch has a low enough Q to excite the neighboring frequencies that ring longer.)
Rick "now knows where he would apply treatments if the wife would agree, which she won't
")
" Denney