Will give it a go next measurement round and follow-up.
Try this once:
Sweep at intervals of 5dB, say from 50dB on up.
Measured distortion will be high at low SPL as noise dominates the measurement, and will fall with each higher SPL measurement, until the real distortion rises out of the noise floor, then the readings will rise.
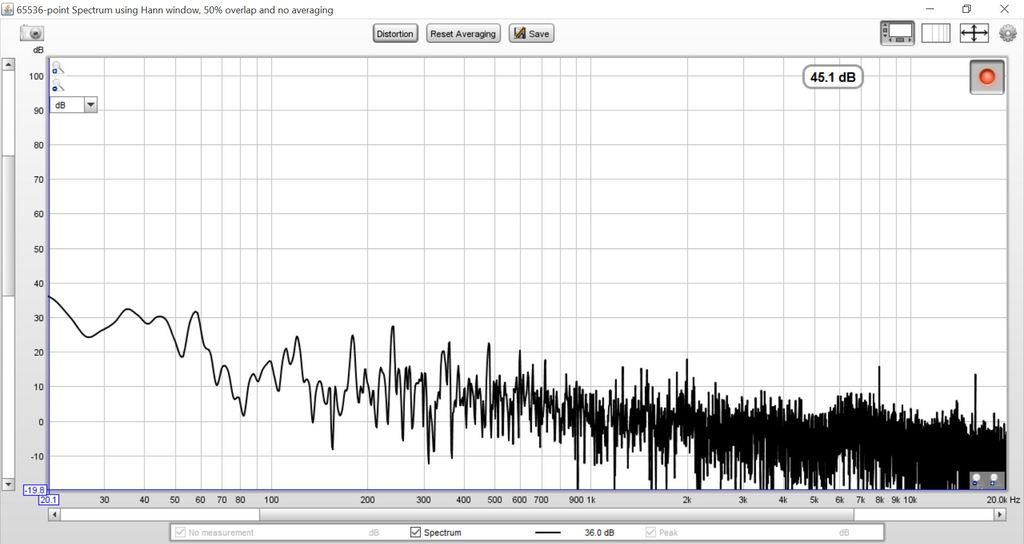
50dB sweep - distortion is room noise, not the speakers.
65dB - higher signal to noise, so lower distortion
80dB - this is the about the turning point - SNR is highest before real distortion comes in
85dB - rising Distortion to Noise ratio
95dB -rising more


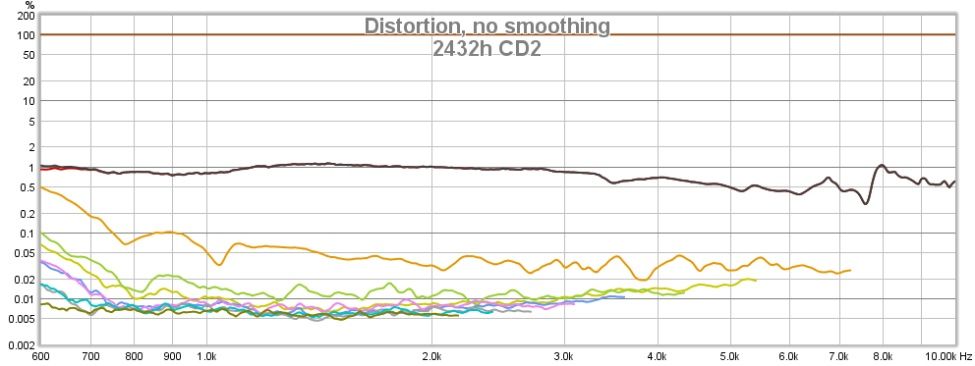
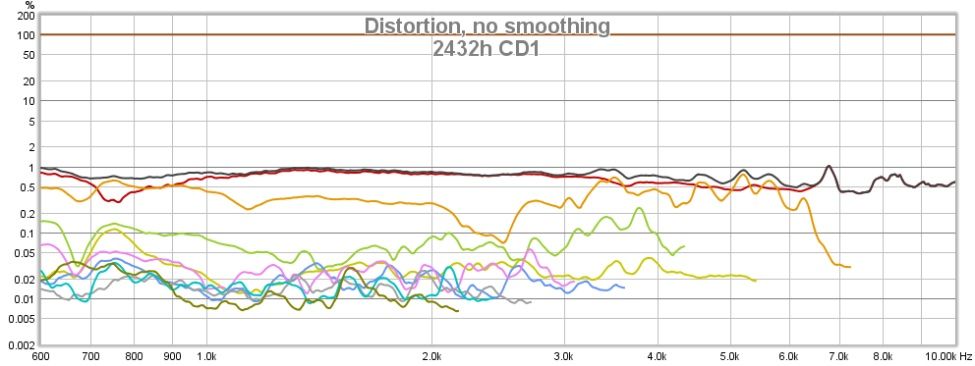
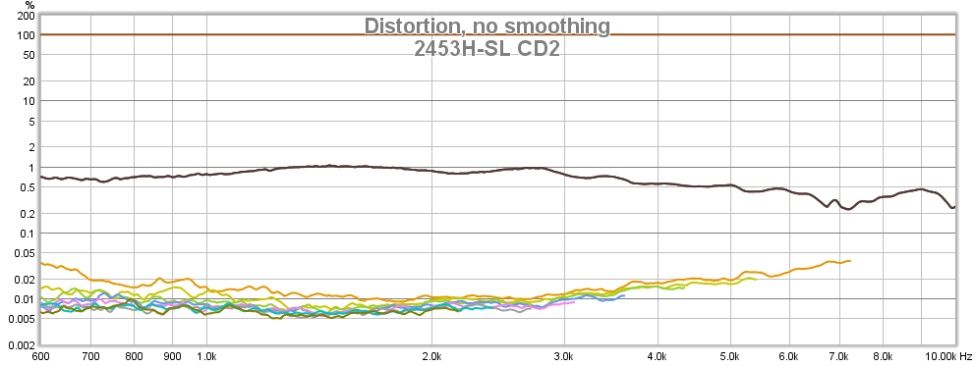
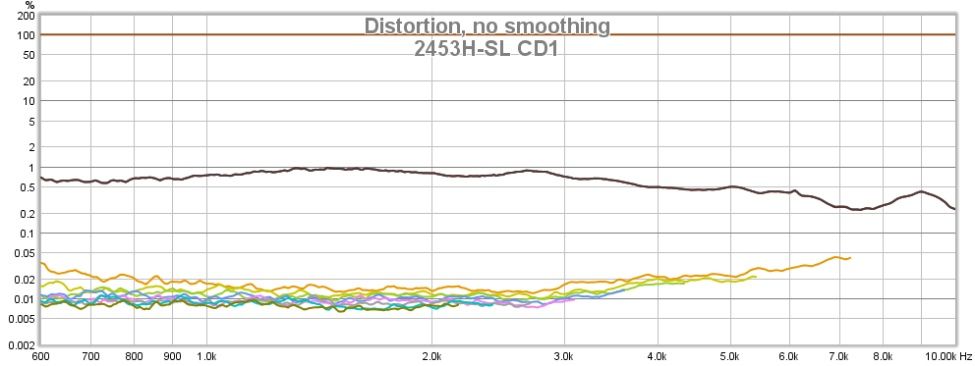
") It's the relative distortion levels between the two different drivers. The 2453h-SL has much less overall distortion than the 2432h driver that were replaced. One of the 2432h drivers has considerably more distortion than the other, like a factory defect or the diaphragm not properly gapped... I have not taken it apart yet. My comment on feedback is how I can make better distortion measurements? I.e. anything wrong or missing from my procedure. Thanks.
It's the relative distortion levels between the two different drivers. The 2453h-SL has much less overall distortion than the 2432h driver that were replaced. One of the 2432h drivers has considerably more distortion than the other, like a factory defect or the diaphragm not properly gapped... I have not taken it apart yet. My comment on feedback is how I can make better distortion measurements? I.e. anything wrong or missing from my procedure. Thanks.