• Welcome to ASR. There are many reviews of audio hardware and expert members to help answer your questions. Click here to have your audio equipment measured for free!

Dirac ART Update

You surely hear the improved decay. The pre-ringing caused by linear phase correction filters may be inaudible by pre-masking - that is why I was questioning its relevance, even if it looks ugly in measurements.
I have no idea why the impulse response is being brought forward. The improvements, huge compared to anything else I have done in my audio 'career', by Dirac ART in the bass domain can be measured by REW, as shown in my original post, I think!
 
OK, I'm 73 and struggled with this but does this help? Please ignore the second ot these three files. The first and third are Dirac ART ON and the OFF.
Thank you for posting this

I wanted to check the Wavelets

1791309444068.png
1791309464925.png


Really huuuuge difference
ART cleaned up all the post-ringing garbage, and yes, pre-ringing is clearly visible too
Try this track with and without ART

If there is any audible pre-ringing, you will hear it with this track. Right in the first few seconds already, if the drums sound like they got reversed a bit - that is pre-ringing
 
Well, all your graphs are labelled "L+R Oct 5" and they are all different. The timing ref is all over the place for some reason, and some of the graphs clearly look better than others. Without knowing what I am looking at, i'm not going to say anything. The SNR is only barely adequate, which is why the decay in the spectrograms probably look worse than they should be. Please name your graphs properly and use something longer than a 256k sweep. Try 1M.

The question is: how audible is this pre-ringing? Is it an issue at all?

I would have thought it should be an issue. Read this article (and watch the video) on the audibility of pre-masking. In particular, pay attention to this:

1791308272842.png


So pre-masking depends on the proximity to the main impulse (the "masker") as well as its amplitude. It may or may not just sneak under the audibility threshold, I do not know. But you can see that it cuts it awfully close.

I have heard an ART system in an audio show, but I was not able to play my own material which would expose the pre-ring. You ideally want a loud full spectrum impulse which is preceded by silence. You can of course use a test signal, but those audio shows won't let me play test signals ;) So maybe a huge Japanese Taiko drum? I have successfully used this to hear pre-ringing in my own system. Try Track 1. It's available on Tidal:

1791308860253.png


Anyway there are dozens of ART systems on ASR now, and not one of them have complained about pre-ring. So the generous interpretation is that it's good enough to be inaudible.

And BTW, I shouldn't call it "pre-ring", because strictly speaking it is not. Pre-ringing is caused by linear phase, as you point out. This is caused by placing the subwoofer impulse before the main impulse. There was another set of ART measurements which I examined which clearly showed this to be the case*. Regardless, the pre-masking auditory threshold still applies.

* If you want to demonstrate this, take this measurement: measure all speakers and subs individually with the same acoustic timing reference. You have to mute channels (if your AVR has this ability) or disconnect speakers (if your AVR can't mute individual channels) to be able to do so.
 
Thanks for the 'daisy chained' problem, which, by the way, I did not mention.. I will fix that problem. So many details...

And thanks for the reference to the Dirac Art thread, which I did not see, obviously. Will do.

The 'support settings' recommendations will take some time to digest.

I am still interested in the question of wtether Dirac ART improves sound, and how to measure it. Did I include the most relevant REW measurements.
Support is pretty easy if you have basic knowledge of your speakers
Thanks to Erins measurements we have have a lot of information on your speakers

Front
F-low 45-50hz
Support lvl -18 or -24, -30 you start to push it i bit far if you play loud

In my setup i do not having any issues watching movies and use the center as support
In your case it is better to ramp it up in stages
Movies test 1
F-low 65hz
Support lvl-10dB

If you cant hear strange things on vocals, Movies test 2
This setting can be used for music as well
F-low 65hz
Support -15dB

Surround,
F-low 55-60hz
Support lvl -15dB


Another tip, you have 3 saves for Dirac filters and two speaker presets
Use the same setup for both presets gives you 6 saves


*edit*
If you can localize upper bas in your surrounds, lower the support lvl or lower the upper support limit from 150hz to 100hz or a bit below
 
Last edited:
By this point I have seen so many ART measurements that when I see this:

View attachment 563000

... I know it's ART. No other DSP would do this.
Can you describe how this, compared to the measurement without Dirac (not shown) in Dolby (11 speakers, 4 subs)) is an improvement. This is not he stereo response of one speaker, measured from a set distance. But I listening portion REW measurement made by REW from a pre/pro running in Dolby mode. Which most closely resembles how I listen t music or movies.
 
Support is pretty easy if you have basic knowledge of your speakers
Thanks to Erins measurements we have have a lot of information on your speakers

Front
F-low 45-50hz
Support lvl -18 or -24, -30 you start to push it i bit far if you play loud

In my setup i do not having any issues watching movies and use the center as support
In your case it is better to ramp it up in stages
Movies test 1
F-low 65hz
Support lvl-10dB

If you cant hear strange things on vocals, Movies test 2
This setting can be used for music as well
F-low 65hz
Support -15dB

Surround,
F-low 55-60hz
Support lvl -15dB


Another tip, you have 3 saves for Dirac filters and two speaker presets
Use the same setup for both presets gives you 6 saves


*edit*
If you can localize upper bas in your surrounds, lower the support lvl or lower the upper support limit from 150hz to 100hz or a bit below
Thanks, will give it a try.
 
Support is pretty easy if you have basic knowledge of your speakers
Thanks to Erins measurements we have have a lot of information on your speakers

Front
F-low 45-50hz
Support lvl -18 or -24, -30 you start to push it i bit far if you play loud

In my setup i do not having any issues watching movies and use the center as support
In your case it is better to ramp it up in stages
Movies test 1
F-low 65hz
Support lvl-10dB

If you cant hear strange things on vocals, Movies test 2
This setting can be used for music as well
F-low 65hz
Support -15dB

Surround,
F-low 55-60hz
Support lvl -15dB


Another tip, you have 3 saves for Dirac filters and two speaker presets
Use the same setup for both presets gives you 6 saves


*edit*
If you can localize upper bas in your surrounds, lower the support lvl or lower the upper support limit from 150hz to 100hz or a bit below
Thanks, I'm going to try to implement this!
 
Thank you for posting this

I wanted to check the Wavelets

View attachment 563011View attachment 563012

Really huuuuge difference
ART cleaned up all the post-ringing garbage, and yes, pre-ringing is clearly visible too
Try this track with and without ART

If there is any audible pre-ringing, you will hear it with this track. Right in the first few seconds already, if the drums sound like they got reversed a bit - that is pre-ringing
Will do! Thanks very much.
 
Thank you for posting this

I wanted to check the Wavelets

View attachment 563011View attachment 563012

Really huuuuge difference
ART cleaned up all the post-ringing garbage, and yes, pre-ringing is clearly visible too
Try this track with and without ART

If there is any audible pre-ringing, you will hear it with this track. Right in the first few seconds already, if the drums sound like they got reversed a bit - that is pre-ringing
 
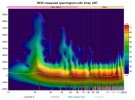
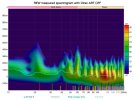
Yes, I think these REW 'spectrograms' are very different too...
 

Attachments

  • Spectrogram with dirac art.jpg
    Spectrogram with dirac art.jpg
    109.3 KB · Views: 79
  • REW mesured spectrogram with Dirac ART OFF.jpg
    REW mesured spectrogram with Dirac ART OFF.jpg
    102.2 KB · Views: 93
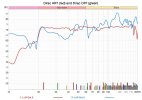
Well, I think it is clear that we cannot agree on how to measure Dirac ART improvements in the time domain. But, can we agree that, in the frequency domain, Durac bass is 'good' or 'excellent'...here's a reminder.
 

Attachments

  • Dirac ON and OFF Oct 5.jpg
    Dirac ON and OFF Oct 5.jpg
    128.1 KB · Views: 71
Well, I think it is clear that we cannot agree on how to measure Dirac ART improvements in the time domain. But, can we agree that, in the frequency domain, Durac bass is 'good' or 'excellent'...here's a reminder.
For what it's worth my experience with ART is that the best first step is to carefully take measurement exactly as described in the documentation and if you don't understand the documents (they are not great) do the research to figure it out. As mentioned ART should be given full control of all the channels, no MSO or other DSP in the signal chain (which can't be avoided with SVS subs) but get as close as you can. Then create a filter in ART with all the default settings. I find this proper measurement and default filter to measure and especially sound the best. The problem with the default filters is that in most cases you give up large amounts of headroom as some speakers are more capable than others and DIRAC treats them all as equal unless you tell it otherwise. None the less for moderate listening levels I always use the default filter. If I want to crank it up (and not hear bottoming out on my less capable subs and the like) I use another filter that I carefully optimised taking all the driver capabilities into account. It can easily play much louder and still measures and sounds great. As far as confirming measurements with REW you can only take this so far. You can certainly use it as a sanity check but not for optimising small differences. In room measurements, especially in the time domain, are fraught with problems and DIRAC ART clearly uses some "psychoacoustic trade offs/ secret sauce" to create filters that "sound good in a small room" which inevitably leads to some compromises. The final tuning, if needed (in my case I like what ART does), is best done by ear.
 
It is difficult to examine bass decay because you need to look at multiple graphs to get a good idea of what is going on. I will take graph 1 as an example, since it is most obviously Dirac ART. There is no point telling you that it is "L+R Oct 5" since the name is so unhelpful.

1791336253403.png


We will start by looking at the frequency response because it provides important context for the graphs we will view next. We see that the bass is commendably flat up to almost 200Hz.

1791335719388.png


Now we look at the waterfall. Here, I have extended the time window to 1000ms, and selected the "Normalise to peak at every frequency" option. The reason you "normalise to peak" is because all peaks will ring for longer, and if you leave it as-is, you will get a misleading view of the decay. Also note that I have expanded the y-axis so that you can see the entire measured spectrum.

There are a few things to see here. First, look at the high frequency decay. Notice how it drops down fairly smoothly before it hits the noise floor. You can see some tones (drops down and then forms a straight line that looks like a sheet) between 200-300Hz and also at 1kHz. That will be extraneous noise in your room producing those tones. Keep these tones in mind for the next graph.

Now look at the bass decay. Notice how lumpy it is. There are a few reasons why:

1. the period is long (50Hz takes (1000/50) 20ms to reproduce), so reflections are already arriving at the microphone before the speaker has finished producing the signal. Those reflections produce the lumpy response.
2. Noise floor typically rises at the bass region, in the same area where the speaker's frequency response is falling. However we know the latter not to be the case since we have examined the FR graph, so the only question is whether we are looking at room noise and not bass decay. It can be incredibly difficult to tell the difference, especially since you have only taken a single 256k sweep. To properly tell, you need to suppress the noise floor as much as possible. Take multiple 1M sweeps then Vector Average them. This can push the noise floor down by as much as 90-100dB.

If you want, you can use the RT60 Decay view to get a better appreciation of the shape of the time slice.

1791336834388.png


Now we look at the spectrogram. Again, I have selected the "Normalise to peak at every frequency" option. The first thing we see is that decay is not uniform across the spectrum. Your bass is much drier than everything above 200Hz. Indeed your room looks very "live". So you would probably benefit from some room treatment above 200Hz.

The next thing to see are all the wisps between 200-300Hz, as well as that tone at 1kHz. Cross reference this to the waterfall where I showed you those tones. That is room noise.

Now we come to that huge spike in "decay" below 30Hz. Cross reference this to the frequency response (first graph), and you will see that your FR drops below 23Hz or so. Then examine the waterfall, and you will see that REW's "Normalise to peak" option has boosted room noise, which is producing that huge decay peak. So we ignore it.

The question is - what is producing all that "decay" between 40-50Hz? See my previous point about signal-noise.

Anyway, your statement:

Well, I think it is clear that we cannot agree on how to measure Dirac ART improvements in the time domain.

... is incorrect. We CAN measure ART improvements in the time domain. You just have to take the proper measurement.

 
For what it's worth my experience with ART is that the best first step is to carefully take measurement exactly as described in the documentation r.
Actually, first point is critical and as long you have at least 30cm between points and that the mic can "see" every speaker just measure roughly a box.
The bigger the area DL will have a bit more uneven response but ART will benefit hugely.
And you can do ART with only 3 measurements but i usually suggest 9 as a minimum


Storm vs Dirac - both works for me and my room

1791345985284.png


1791346171549.png
 
It seems to me the target line is 2-3 dB too low for the actual bass response and you are filtering driver's direct output instead of reflections:

1791355439925.png
 
It seems to me the target line is 2-3 dB too low for the actual bass response and you are filtering driver's direct output instead of reflections:

View attachment 563088
I have it set for a flat bass response. I like it that way. It is operating in the mode calculated by Dirac, without alterations of individual speaker parameters. What made you think I am "... filtering driver's direct output instead of reflections"?
 
It is difficult to examine bass decay because you need to look at multiple graphs to get a good idea of what is going on. I will take graph 1 as an example, since it is most obviously Dirac ART. There is no point telling you that it is "L+R Oct 5" since the name is so unhelpful.

View attachment 563060

We will start by looking at the frequency response because it provides important context for the graphs we will view next. We see that the bass is commendably flat up to almost 200Hz.

View attachment 563059

Now we look at the waterfall. Here, I have extended the time window to 1000ms, and selected the "Normalise to peak at every frequency" option. The reason you "normalise to peak" is because all peaks will ring for longer, and if you leave it as-is, you will get a misleading view of the decay. Also note that I have expanded the y-axis so that you can see the entire measured spectrum.

There are a few things to see here. First, look at the high frequency decay. Notice how it drops down fairly smoothly before it hits the noise floor. You can see some tones (drops down and then forms a straight line that looks like a sheet) between 200-300Hz and also at 1kHz. That will be extraneous noise in your room producing those tones. Keep these tones in mind for the next graph.

Now look at the bass decay. Notice how lumpy it is. There are a few reasons why:

1. the period is long (50Hz takes (1000/50) 20ms to reproduce), so reflections are already arriving at the microphone before the speaker has finished producing the signal. Those reflections produce the lumpy response.
2. Noise floor typically rises at the bass region, in the same area where the speaker's frequency response is falling. However we know the latter not to be the case since we have examined the FR graph, so the only question is whether we are looking at room noise and not bass decay. It can be incredibly difficult to tell the difference, especially since you have only taken a single 256k sweep. To properly tell, you need to suppress the noise floor as much as possible. Take multiple 1M sweeps then Vector Average them. This can push the noise floor down by as much as 90-100dB.

If you want, you can use the RT60 Decay view to get a better appreciation of the shape of the time slice.

View attachment 563061

Now we look at the spectrogram. Again, I have selected the "Normalise to peak at every frequency" option. The first thing we see is that decay is not uniform across the spectrum. Your bass is much drier than everything above 200Hz. Indeed your room looks very "live". So you would probably benefit from some room treatment above 200Hz.

The next thing to see are all the wisps between 200-300Hz, as well as that tone at 1kHz. Cross reference this to the waterfall where I showed you those tones. That is room noise.

Now we come to that huge spike in "decay" below 30Hz. Cross reference this to the frequency response (first graph), and you will see that your FR drops below 23Hz or so. Then examine the waterfall, and you will see that REW's "Normalise to peak" option has boosted room noise, which is producing that huge decay peak. So we ignore it.

The question is - what is producing all that "decay" between 40-50Hz? See my previous point about signal-noise.

Anyway, your statement:


... is incorrect. We CAN measure ART improvements in the time domain. You just have to take the proper measurement.
I will remeasure based on your suggestions and to the best of my ability later this week. I am having a problem with labeling REW files, which appeared on my MacBook Air when I updated the software. Maybe I'm missing something, like a proper brain!, but has anyone else faced a similar issue?
 
By this point I have seen so many ART measurements that when I see this:

View attachment 563000

... I know it's ART. No other DSP would do this.
Hi, I always appreciate your posts everywhere. I have Art and similar step too. Would you share what should be a good step response example?
 
Well, I think it is clear that we cannot agree on how to measure Dirac ART improvements in the time domain.

BTW, I should point out that the seeming disagreement is because other people use other views to look at bass decay. I showed you my method, but it is by no means exhaustive. There are others, e.g. looking at the length of the ringing in the step response, using the spectrogram wavelet view, and so on. Like I said, all those different graphs have different strengths and weaknesses, and you can easily be misled if you select the wrong view.

Anyway, I came across a measurement on another forum and it is an excellent illustration of that lumpy bass decay I was talking about.

1-2.gif


It is easiest if I make an animation so that you can see the difference. Note that once again I have (1) extended the time window to 1000ms, (2) extended the vertical scale so that you can see the noise floor clearly, and (3) selected the "normalise to peak" option again.

Now look at how those lumps change between measurements. If they stay the same - it's a reflection. If it changes, it's noise. You can see that the noise is as high as -10dB to the signal in this particular measurement.

You can also see a few tones in his measurement. The loudest tone is at 60Hz, which doesn't change between measurements. There are other tones, e.g. at 70Hz and 100Hz which change quite a lot.

Sometimes, nulls in the FR can dip below the noise floor. But in this particular case:

1791378553034.png


... his frequency response is commendably flat ...

1791378882574.png


... if you look at the un-normalized waterfall, note that I placed my marker at a dip in his FR. You can see that the noise floor is very low at that particular point.

Anyway, this is another way to determine whether noise is corrupting your bass decay measurement.
 
Last edited:
Hi, I always appreciate your posts everywhere. I have Art and similar step too. Would you share what should be a good step response example?

Please see REW Book 2 (link in my signature) for examples of an ideal step response. You can simulate it yourself. Using REW's "EQ" feature, create a bandpass filter. HPF 20Hz, Butterworth 4th order, and LPF 20kHz, Butterworth 4th order. That simulates an ideal minimum-phase speaker with a spectrum of 20Hz - 20kHz. Then go and examine all the graphs, including the step response.

1791379550595.png


(EDIT) I have created that ideal step response (in black). Here it is in comparison to the OP's measurement.
 
Last edited:
Back
Top Bottom