• Welcome to ASR. There are many reviews of audio hardware and expert members to help answer your questions. Click here to have your audio equipment measured for free!

DAC listening test files - updated with new filters files

OK, maybe it would be better to show the exact part of the music sample that I take for the abx.
This part with about 1.67s duration. As I have mentioned several times, the difference perceived is absolutely unimportant and irrelevant during normal listening. The orange ellipse points to crash cymbal strike.
+/-0.01dB ripple is not masking anything. But you and me use different DACs, different headphones, we have different ears and different experience in abx testing. So, we cannot expect absolutely same abx results. In my opinion, training in abx testing is the most important item, provided that the testers would use the same hardware.

Thanks, that chart was interesting. There are visible differences between the two traces, and not just within the ellipse. I didn't expect that.
 
Thanks, that chart was interesting. There are visible differences between the two traces, and not just within the ellipse. I didn't expect that.
Oh no, sorry for the confusion. It is the stereo file DAC1 and the difference you see is between the channels. I wanted to navigate what to listen in the abx.
DAC1 x DAC2 files overlap, without magnification.
 
Oh no, sorry for the confusion. It is the stereo file DAC1 and the difference you see is between the channels. I wanted to navigate what to listen in the abx.
DAC1 x DAC2 files overlap, without magnification.
Ah, that explains that then.
 
  • Like
Reactions: pma
Ah, that explains that then.

If you are seeking for direct comparison of DAC1 x DAC2 plots near the decisive interval, in one graph, then it looks like below. The image is big, so click on the thumbnail.

DX5_D10s_togther.pngDX5_D10s_timezoom.png
 
Last edited:
@welwynnick : You post here and there, do you have an idea why do we stick in their craw at AS?
 
@welwynnick : You post here and there, do you have an idea why do we stick in their craw at AS?
I drafted and saved several different answers to that question, but didn't want anyone to see any of them.
The least contentious is that some people expected Josh to see things from their point of view, but that didn't work both ways.
 
Let me say it is complicated. Both ways.

My position is this: If there is an audible difference (under controlled double blinded test conditions), then there must be a technical reason. And all I want to know is why. What is that technical reason.
 
Last edited:
OK, maybe it would be better to show the exact part of the music sample that I take for the abx.

View attachment 554684

This part with about 1.67s duration. As I have mentioned several times, the difference perceived is absolutely unimportant and irrelevant during normal listening. The orange ellipse points to crash cymbal strike.

+/-0.01dB ripple is not masking anything. But you and me use different DACs, different headphones, we have different ears and different experience in abx testing. So, we cannot expect absolutely same abx results. In my opinion, training in abx testing is the most important item, provided that the testers would use the same hardware.

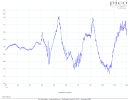
Spectrum of that sample interval, right channel

R DAC1_shrt.png

----------------------------------------------

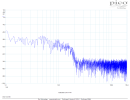
Spectrum in delta file (Deltawave file diffence between DX5 and D10s) near 10.5s:

DX5_D10s_deltaspectrum.png


Please note that the spectrum of delta file during the crash cymbal strike is wideband with components of similar amplitude up to some 13 kHz.
 
Last edited:
If you are seeking for direct comparison of DAC1 x DAC2 plots near the decisive interval, in one graph, then it looks like below. The image is big, so click on the thumbnail.
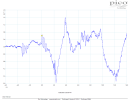
Honestly, that just looks identical at first glance :D Even looking a second and a third time, all I can spot is the tiniest of differences in what may be the phase around the peaks. And even that may be an illusion caused partly by a small time shift of 1/5th or 1/10th of a sample between the recordings relative to the played back track.
 
My position is this: If there is an audible difference (under controlled double blinded test conditions), then there must be a technical reason. And all I want to know is why. What is that technical reason.
I completely agree. I would want to understand.
But suppose I got a positive result from a proper controlled listening list, and the measurements said the equipment performed the same.
I would repeat the listening test and look for some better measurements, but I wouldn't throw out the listening test result.
 
deleted. I misunderstood what I was looking at.
 
Last edited:
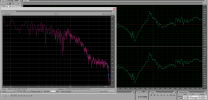
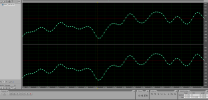
I have some high speed single shots of waveform and spectrum of the DAC1 test file as well, just in the same interval near the 10.5 s of the music sample. It shows the speed and wide spectrum of the transients.

DAC1 testfile highspeed timeshot.png DAC1 testfile highspeed timeshot1.png DAC1 testfile highspeed spectrumshot.png DAC1 testfile highspeed timeshot2.png
 
Last edited:
I have some high speed single shots of waveform and spectrum of the DAC1 test file as well, just in the same interval near the 10.5 s of the music sample. It shows the speed and wide spectrum of the transients.

View attachment 554898 View attachment 554897 View attachment 554896 View attachment 554900
I am trying to follow along here. The timeshots are both labeled DAC1. Are they L and R, or something else?
edit: Checking the files I figure out (I think) the timeshots are two different sections, one starting at about 10.5 sec and the other about 11.2 sec.
 
Last edited:
Results charts updated for p-value

I have summarized the collected results and calculated p-value for each participant in each test (from summarized result in each test) and added it to new columns in the results chart. The strict condition for the green pass is p <= 0.05. Thus, 8/10 with p = 0.055 does not count. There are only two results with p <= 0.05. Josh in test #4 (DM+ x D10s) and my in test #2 (D10s x DX5). However, I would appreciate if @Josh83 posted more than one and only result in the test #4, being 9/10. Thus, for a lack of trials, I am giving a green pass for the p value and a yellow pass for the number of trials.
We did not collect more results with p <= 0.05 than these two. But they seem to be two strong results with p = 0.011. We have collected another two results close to p<=0.05, with p = 0.055. They are marked in dark yellow.

DACtest_results5_ASR_2026-08-27.png
 
Last edited:
@pma Don't the test #2 that you did, and the #4 test that I did fail since there were also poorer scoring rounds (I had a 7/16 for Test #4 that isn't on your chart)? If something was discovered to help pass after having already done the poor scoring rounds, what is the proper way to deal with this?
 
@pma Don't the test #2 that you did, and the #4 test that I did fail since there were also poorer scoring rounds (I had a 7/16 for Test #4 that isn't on your chart)? If something was discovered to help pass after having already done the poor scoring rounds, what is the proper way to deal with this?
The test #2 I did has total score 53/84 which makes p = 0.011. Or 1.07%. That's the result of cold boring probability/statistics calculation. So no, they do not. This is not about philosophical disputations.
 
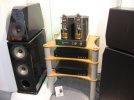
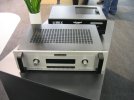
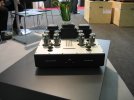
Maybe I should add some photos from my audiophile years, to add weight to my arguments :D. Hopefully those long years are over.
 

Attachments

  • munich 009.jpg
    munich 009.jpg
    292.6 KB · Views: 68
  • munich 012.jpg
    munich 012.jpg
    381.9 KB · Views: 66
  • munich 013.jpg
    munich 013.jpg
    338.4 KB · Views: 57
  • munich 016.jpg
    munich 016.jpg
    288.9 KB · Views: 62
  • munich 017.jpg
    munich 017.jpg
    329.2 KB · Views: 62
  • munich 018.jpg
    munich 018.jpg
    443.4 KB · Views: 56
  • img288-1.jpg
    img288-1.jpg
    295 KB · Views: 65
  • img639-1.jpg
    img639-1.jpg
    134.6 KB · Views: 51
  • img648-1.jpg
    img648-1.jpg
    123.6 KB · Views: 68
The test #2 I did has total score 53/84 which makes p = 0.011. Or 1.07%. That's the result of cold boring probability/statistics calculation. So no, they do not. This is not about philosophical disputations.
I should have run those numbers. sorry. But I did fail on test #4 if you include my 7/16 first attempt.
 
I have either overlooked it or there was not a complete protocol. I have only considered the foo abx reports with a log signature.
 
I have either overlooked it or there was not a complete protocol. I have only considered the foo abx reports with a log signature.
It was post #344 where I reported 7/16. But it looks like I messed up and did not include the signature. Maybe since I am wanting to use it to take myself down you will trust my honesty on that one!
 
Back
Top Bottom