As opposed to worrying about the measurement protocol - and since we have an already significant set of measurements made without grilles changing is actually disruptive - there is probably a good case for a little diversion to test a couple of speakers with and without to create an article addressing the impact of grilles, and then just leave the issue alone.

-
WANTED: Happy members who like to discuss audio and other topics related to our interest. Desire to learn and share knowledge of science required. There are many reviews of audio hardware and expert members to help answer your questions. Click here to have your audio equipment measured for free!
You are using an out of date browser. It may not display this or other websites correctly.
You should upgrade or use an alternative browser.
You should upgrade or use an alternative browser.
Complaint thread about speaker measurements
- Thread starter amirm
- Start date
Based on what I have measured over the past 20 years or more, every speaker I have measured with a grill on has had worse frequency response than having it off. I could post this, but there are plenty of more recent examples in this thread that seem to confirm. Ideally, you would hope that the grill was an integral part of the design, but that seems to be a rare occurrence.
My conclusion was that, unless the manufacturer insists that the speaker sounds better with the grill on, you can pretty much figure the grill was added for reasons other than improved sound quality.")
Indeed. My favorite compromise between aesthetics/sound/protection is what Focal does and B&W on some models. Permanent grille on the tweeter - meaning the sound is designed around it, and an optional grille for the woofer(s), where it has a relatively minimal effect.
These guys addressed the grill question recently...
https://www.audioholics.com/loudspeaker-design/grilles
Note this was years after the members had already weighed in...
https://forums.audioholics.com/forums/threads/to-grill-or-not-to-grill.56396/
https://www.audioholics.com/loudspeaker-design/grilles
Note this was years after the members had already weighed in...
https://forums.audioholics.com/forums/threads/to-grill-or-not-to-grill.56396/
Last edited:
tuga
Major Contributor
Is something happening at 2kHz?

Colonel7
Addicted to Fun and Learning
Just stumbled across this part of the thread after checking out after the flame war a ways back. Thanks for your insight. I have wharfedale 225s that measure better with the grills off than on according to stereophile. Alas I have to keep them on due to inquisitive kiddosI try to do grille on grille/offmeasurements(though I do often forget). Usually what I do is run a separate grille off and on measurement to minimize variation with my primary on/off axis sweeps.
The effect does vary quite a bit from speaker to speaker, so I do think it's a somewhat worthwhile endeavor. Most speakers measure worse imo, but for some the effect seems negligible or even improves the sound. Although like @amirm I do assume that most of the people who care about sound will be using it without a grille - and they do care and are using a grille, it is out of necessity.
Since the effects are usually constrained to high frequencies, maybe amir can just run a quick gated sweep with the grille on and off rather than the full shebang? Not sure how much that affects things logistically.
Some examples of grille on/off. I have not yet tested off-axis with the grille on, which might be interesting to see.
SVS Prime elevation:
View attachment 55346
Definitely worse with the grille on.
L100 Classic (blue is not relevant here):
View attachment 55347
Small difference that is almost completely fixable with the tuning knobs, although the 3.7Kish dip is a bit steeper. That's with the grille off.
PSB Alpha P5:
View attachment 55348
The response might actually be a bit better with the grille on, depending on how sensitive you are to the top octave? The highs seem better balanced overall with the mids, though the 3.5K dip is relatively steeper.
Is something happening at 2kHz?
Yep, looks like it:
It looks quite benign though. High Q, about ±0.5 dB. I wouldn't worry about it, though it would be nice to fix it of course.
tuga
Major Contributor
This has been mentioned before by other members.
Would it be possible to remove the comments from the measurement plots (highlighting arrows and circles are fine)?
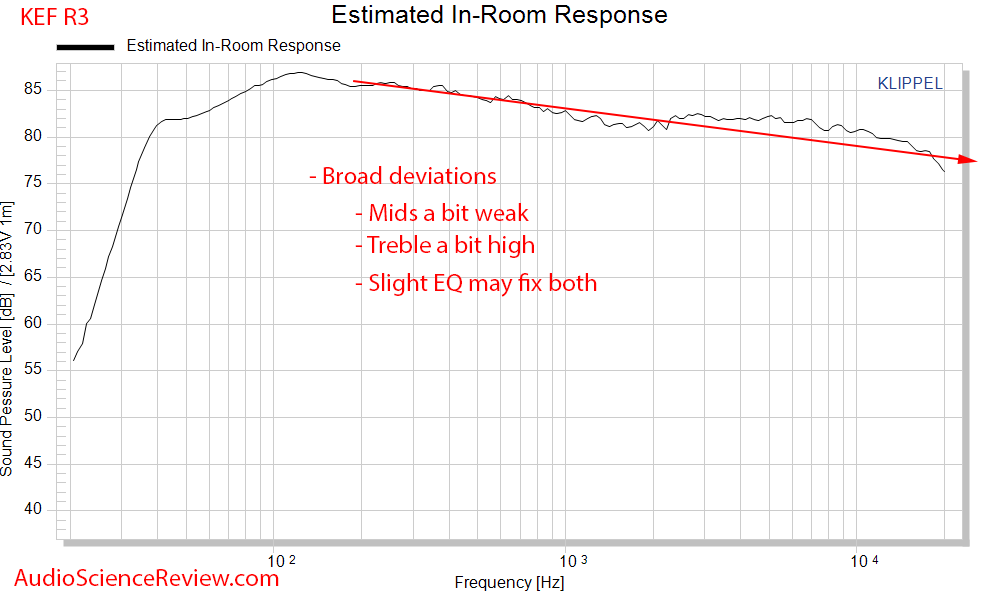
Going over the different speakers there doesn't seem to be a coherent approach to commenting, it's too subjective and shows broad deviations from neutral (the benchmark). For example:


Would it be possible to remove the comments from the measurement plots (highlighting arrows and circles are fine)?
Going over the different speakers there doesn't seem to be a coherent approach to commenting, it's too subjective and shows broad deviations from neutral (the benchmark). For example:
tuga
Major Contributor
Also I think that @amirm should be using a standard designation for the frequency bands:
Lower Frequencies
Sub-bass : 20 to 60 Hz
Bass : 60 to 250 Hz
Midranges
Low midrange : 250 to 500 Hz
Midrange : 500 Hz to 2 kHz
Upper midrange : 2 to 4 kHz
Higher Frequencies or Treble
Presence : 4 kHz to 6 kHz
Brilliance : 6 kHz to 20 kHz
Lower Frequencies
Sub-bass : 20 to 60 Hz
Bass : 60 to 250 Hz
Midranges
Low midrange : 250 to 500 Hz
Midrange : 500 Hz to 2 kHz
Upper midrange : 2 to 4 kHz
Higher Frequencies or Treble
Presence : 4 kHz to 6 kHz
Brilliance : 6 kHz to 20 kHz
"Easy for you to say"Buy it.
Amir, I have seen you describe the data generated by the NFS in a couple of speaker reviews - how many data points are collected and how large the data size is...
Is this data in proprietary Klippel format or comparatively open? Are you open to sharing this raw data?
Not much use to me but I think @BYRTT can generate some sexy visualizations using it.
Is this data in proprietary Klippel format or comparatively open? Are you open to sharing this raw data?
Not much use to me but I think @BYRTT can generate some sexy visualizations using it.
Amir, I have seen you describe the data generated by the NFS in a couple of speaker reviews - how many data points are collected and how large the data size is...
Is this data in proprietary Klippel format or comparatively open? Are you open to sharing this raw data?
Not much use to me but I think @BYRTT can generate some sexy visualizations using it.
Thanks
software i use is free VituixCAD feeded Amir's spindata that he attach within first few posts for acoustic reviews, if you happy use VituixCAD or need a quick start guide i can post it here also i have a spreadsheet with a macro that automatic extract directivity curves from Amir's format to a understandable format in VituixCAD, animations are done in a old homeuser version from Adobe named Photoshop Elements v11.
OP
- Thread Starter
- #392
NO. The raw data is given for that and others plot them that way. People are confused about the graphs without the notations as it is hard to associate words around a graph to the graph itself.Would it be possible to remove the comments from the measurement plots (highlighting arrows and circles are fine)?
OP
- Thread Starter
- #393
It depends on how the measurements are run. The latest versions range from 300 megabytes to 400 megabytes. Some of the earlier, higher resolution scans exceeded full gigabyte. The number of measurement points (which is usually between 600 and 1000) and resolution of the chirp signal/averaging create the massive dataset. I currently use 3 times averaging and I think the resolution is 1.7 Hz or something like it.Amir, I have seen you describe the data generated by the NFS in a couple of speaker reviews - how many data points are collected and how large the data size is...
Is this data in proprietary Klippel format or comparatively open? Are you open to sharing this raw data?
The data is proprietary and in database format. The viewer is free so should I release such large files, they can be examined and plotted as I do. I am hesitant to post it though. I don't want to replace the work that testing labs do for speaker manufacturers. And hosting such data can get expensive in a hurry. It may also push me into bandwidth caps for my ISP just for uploading!
There is also the concern of presenting the raw data in incorrect ways and yet attributing it to me measuring them.
So for now at least, please don't push me to do it.
I think I have released more data than anyone has in measurement space.Appreciate the background Amir and I understand now that publishing raw data may create more headaches for you than entertainment for me.It depends on how the measurements are run. The latest versions range from 300 megabytes to 400 megabytes. Some of the earlier, higher resolution scans exceeded full gigabyte. The number of measurement points (which is usually between 600 and 1000) and resolution of the chirp signal/averaging create the massive dataset. I currently use 3 times averaging and I think the resolution is 1.7 Hz or something like it.
The data is proprietary and in database format. The viewer is free so should I release such large files, they can be examined and plotted as I do. I am hesitant to post it though. I don't want to replace the work that testing labs do for speaker manufacturers. And hosting such data can get expensive in a hurry. It may also push me into bandwidth caps for my ISP just for uploading!
There is also the concern of presenting the raw data in incorrect ways and yet attributing it to me measuring them.
So for now at least, please don't push me to do it.
If you can post a guide and macro, that will be super!Thanks
tuga
Major Contributor
NO. The raw data is given for that and others plot them that way. People are confused about the graphs without the notations as it is hard to associate words around a graph to the graph itself.
You could always number the issues and use a legend.
I find that some of the notations/interpretations are confusing or misleading. I understand that this has been a process that's been growing in scope and experience as you go along but as you might yourself have noticed there is sometimes a lack of consistency in the comments which will be permanently engraved into the plots.
Just a suggestion; I am able to make my own interpretation either way, and draw my own conclusions.
My friend uses a laser vibrometer to measure the radiation from cabinet walls of speakers he is designing for clients. He uses the measurement to verify the FE analysis of the cabinet and to calculate sound radiation from the cabinet.
It is significant, and as I wrote up post the speakers using the well engineered cabinet with modest but well engineered drivers sound superior to SOTA drivers in a simple box of the same volume - his conclusion not mine, I haven't got any experience of such a comparison but he has been refining the technique for decades.
That has essentially been shown in some of the JBL an Revel data. The M22 has superior drivers to the M16 but the M16 has newer generation enclosure technology which gives it a better spinorama.
The difference between the HDI-1600 and HDI-3600 reflects some of those cabinet effects also. Subjectively, satellites always had better imaging than floor standers but the trade off was integration with a mono sub. Dual subs helps to ameliorate that problem.
My JBL 4319 has extremely sophisticated drivers but the design requirement for a vintage cabinet also leads to a worse spinorama.
OP
- Thread Starter
- #398
Then you shouldn't waste my time with suggestions that are of no value to you.Just a suggestion; I am able to make my own interpretation either way, and draw my own conclusions
tuga
Major Contributor
That has essentially been shown in some of the JBL an Revel data. The M22 has superior drivers to the M16 but the M16 has newer generation enclosure technology which gives it a better spinorama.
The difference between the HDI-1600 and HDI-3600 reflects some of those cabinet effects also. Subjectively, satellites always had better imaging than floor standers but the trade off was integration with a mono sub. Dual subs helps to ameliorate that problem.
My JBL 4319 has extremely sophisticated drivers but the design requirement for a vintage cabinet also leads to a worse spinorama.
Spinorama performance is mostly the result of drivers, crossover and baffle design.
What Frank was referring to is the (distortion) contribution of the cabinet to the sound which is (all but) impossible to determine in a Spinorama.
According to the listening assessment of the JBL 4319 it looks likely that performance suffers from cabinet contribution yet this problem is not visible in the Spinorama.
tuga
Major Contributor
Then you shouldn't waste my time with suggestions that are of no value to you.
I was thinking about your readers that are not proficent at interpreting measurements and the effectiveness of your message.
Similar threads
- Replies
- 132
- Views
- 14K
- Poll
- Replies
- 65
- Views
- 13K
- Replies
- 331
- Views
- 43K
- Replies
- 2K
- Views
- 164K