
@MrPeabody , the impedance graph is measured on the same speaker that was tested as a load. And it corresponds to JBL datasheet. Re your surprise, please read the phase plot as well, not only the magnitude. You will see that the speaker complex impedance is capacitive between 3 and 8 kHz. This capacitance is added to filter capacitance and must change the frequency response. This is just physics, electrical engineering circuit analysis. And this must count with both magnitude and phase of the impedance. Magnitude plot is only a half of the story. Sorry for being technical, but it is needed for an explanation.
That the impedance is capacitive in that range is apparent in that this type of impedance plot shows capacitive reactance with negative slope and inductive reactance with positive slope. I'm not suggesting that there is anything at all wrong with you graph, only that it hasn't been adequately explained. For you to say something like, "This is just physics, electrical engineering circuit analysis" is not the least bit informative, and frankly a tad bit annoying. I suppose I must have misinterpreted your response graph. For some reason I had assumed that it was obtained by measuring RMS voltage at the speaker terminals. The reason I assumed this is that it seemed to suggest that other than the response variations brought on the effect under consideration, the response of the speaker is ruler flat in the truest possible sense. I'm now thinking that maybe your response curve was obtained by taking the difference between the speaker's acoustic response when connected to an amplifier with extremely low and uniform output vs. the speaker's acoustic response when driver by this class D amplifier. But I'm still only guessing.
")
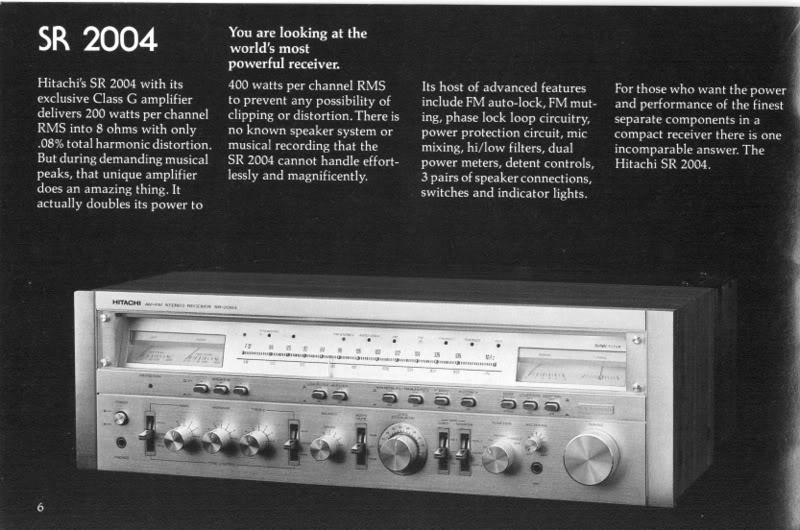 HitachiSR2004