Welcome to the community, great to see you joining the conversation!
")
Can you explain how the threshold curve the user adjusts is actually processed by your application?
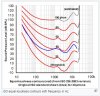
I did a few tests yesterday and found that the curves I created were very bright, as if they followed an upward slope. To my understanding a hearing threshold curve should have a significant bass boost due to the low hearing sensitivity at minimum level. Here you can see both the 0 Phon and 80 Phon curve (which I pull up as an assumption for an average listening level) matched at 1 kHz:
As you can see the 0 Phon curve should lead to a strong bass boost of up to 37 dB which is even further emphasized by the attenuation between 1 kHz and 6 kHz, all compared to the average of 80 Phon. In theory you would have to apply the grey curve to convert the 0 Phon response you detected with the calibration tool to get something that sounds more or less balanced at average listening levels. So you would actually take bass away instead of adding it.
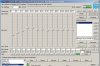
I confirmed the observation above by listening to the sine waves generated by your calibration tool but adjusting the faders in the EQ APO editor instead. Before you ask: I used the graphical equalizer and matched the bands to those of the reference, of course.
The result is pretty much what you would expect looking at the graphs above: a very boomy profile with recessed upper mids and presence.
At that point I ask myself why the curves I created with your calibration tool are so bright, even with the correction applied.
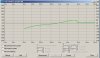
Speaking of correction, here is the compensation curve of your calibration tool (1.0) compared to my personal preference:
I may add a little bit of treble attenuation later. Needs more data for verification.
And some eq curves I generated for my Audioquest Nighthawk (Brainwavz Hybrid):
There were a few hours between the two tests. So there may be some discrepancies due to the headphones seating and physiological fatigue. I may repeat the test in near future to gather more data and get more confident with the technical procedure.
However, what you can see already is that my personal preference curve (which is the smoothed average of several loudness experiments I did in the past weeks) is right in middle between the first and second run with your calibration tool for 300 Hz to 10 kHz. The bass is lacking, as already mentioned. The upper end around 10 kHz is really hard to judge because of its high pitch. I boosted those frequencies until I was really sure I could hear the sizzle turning the tone on and off. As it turned out the gain for the air frequencies is much higher than I prefer in practice, listening to music. I may include that into my correction in case the phenomenon keeps to persist.
I think the procedure could definitely profit from narrow band white or pink noise (white = neutral curve, pink = brighter curve) as a test signal. As with the room modes for loudspeakers it makes more sense to excite a broader area of the spectrum to counterbalance dips and peaks in the spectrum. This is especially important for the higher frequencies where the headphone and the individual's ear morphology unpredictably interact with each other. Such effects could easily be skipped with a lower number of bands and a sinusoidal test tone.
Overall the calibration tool has a lot of potential. I am excited about the further development of this project and really appreciate your openness to the community!
Best wishes,
P48