OP
Mentalrudy
Member
- Joined
- Oct 31, 2020
- Messages
- 27
- Likes
- 6
- Thread Starter
- #21
Hard to know what you're hearing particularly. Where are the consultant's graphs of before and after?
Hi Chrispy,
Here are all data measured by the firm.
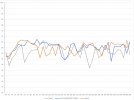
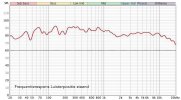
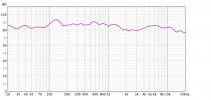
Pic 1: before, sitting down at LP
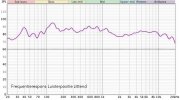
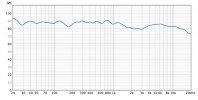
Pic 2: before, standing up at LP
Pic 3: before, graph overlay sitting (purple) vs standing (red)
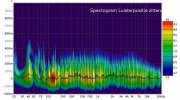
Pic 4: before, spectogram sitting
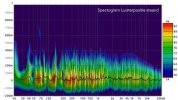
Pic 5: before, spectogram standing
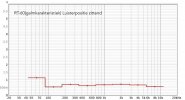
Pic 6: before, RT-60 sitting
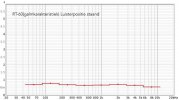
Pic 7 idem but standing
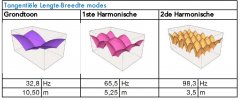
Pic 8 - 12: room modes calculated by Amroc
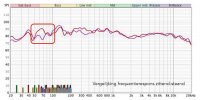
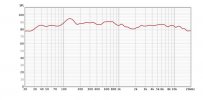
Pic 13: SPL after, sitting at LP
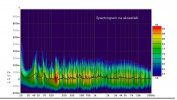
Pic 14: spectogram after, sitting
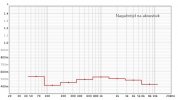
Pic 15: RT-60 after, sitting
And then, just for fun 'after' measurements were made with the addition of a sub, but without crossover/high pass (because of teh limitations of my amp) just to see if a sub would make a difference:
Pic 16: 16, with sub, no crossover, at LP sitting
Pic 17: with sub, no crossover, LP moved 1-2 feet forward. Gave best result subjectively
Pic 18: proposed crossover settings by firm
When reviewing these measurements carefully, maybe it's worth giving it a shot by swapping the amp to an amp with bass management and crossover + dsp, and moving the LP forward. Like f.i. the new NAD 389 or even just by adding a minidsp. My only reservations about the minidsp is the quality of the analog inputs (my listening is 75% vinyl). Although one could argue that what is gained by adding bass management and dsp will vastly outweigh the quality loss from the analog inputs on the minidsp. Am I correct?
Attachments
-
 1 before - sitting at LP.jpg226.7 KB · Views: 67
 -
 2 before - standing up at LP.jpg230.7 KB · Views: 75
 -
 3 graph overlay sitting (purple) - standing up (red) before treatment.jpg222.2 KB · Views: 76
 -
 4 spectogram before - sitting at LP.jpg160.1 KB · Views: 75
 -
 5 spectogram - before - standing up at LP.jpg214.9 KB · Views: 69
 -
 6 RT-60 before - sitting at LP.jpg205.9 KB · Views: 62
 -
 7 RT-60 before - standing up at LP.jpg203.7 KB · Views: 62
 -
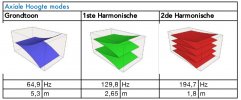 8 axial height.jpg125.3 KB · Views: 61
 -
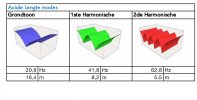 9 axial length.jpg93.4 KB · Views: 57
 -
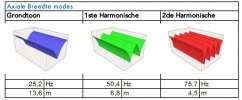 10 axial width.jpg123.4 KB · Views: 60
 -
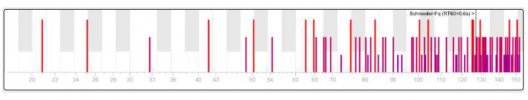 12 modes distr.jpg61.7 KB · Views: 66
 -
 11 tangential.jpg125 KB · Views: 60
 -
 13 spl after.jpg73.9 KB · Views: 68
 -
 14 spectogram after.jpg98.7 KB · Views: 61
 -
 15 RT-60 after.jpg123.1 KB · Views: 55
 -
 16 after - with sub - no crossover.jpg108.8 KB · Views: 164
 -
 17 after - LP 1 to 2 feet forward - with sub.jpg108.7 KB · Views: 69
")