• WANTED: Happy members who like to discuss audio and other topics related to our interest. Desire to learn and share knowledge of science required. There are many reviews of audio hardware and expert members to help answer your questions. Click here to have your audio equipment measured for free!

Beta-test: DeltaWave Null Comparison software

OP
pkane

pkane

Master Contributor
Forum Donor
Joined
Aug 18, 2017
Messages
5,699
Likes
10,383
Location
North-East
It can be handy for users to pick where the unwrapped plot passes through the -180..180 range, so the range is narrower near that region of interest. Also need to remove anything that looks like a pure time delay from the data before unwrapping it (or an underlying linear trend, which amounts to the same thing), otherwise the phase steps at high frequency can be too large for unwrapping to work. Not sure how meaningful that is for this kind of comparative data though.

Thanks, John! I already remove linear trend from the wrapped data, but I like the selectable -180°/180° range suggestion.
 
OP
pkane

pkane

Master Contributor
Forum Donor
Joined
Aug 18, 2017
Messages
5,699
Likes
10,383
Location
North-East
v1.0.22 with some bug fixes and new features is now available

Changes in 1.0.22b
  • Added a manual adjustments window with a manual and automatic tester/optimizer of null parameters
    (Process->Manual Adjustments…menu)
  • Added option for exporting WAV data in various combinations
    (File->Export WAV File… menu)
  • Added Unwrap Phase option
    (View->Charts->Unwrap Phase menu) for delta phase display
  • Optimized for precision in calculations, ensuring only significant digits are used in processing, increased precision
  • Changed the logic to automatically switch to the alternative drift correction algorithm if the default one doesn’t produce a valid result
  • Added an error message and a stop when a proper match is not found
  • Fixed the position selector for Lissajous plot
  • Added DC value and all the computed values in raw format to the Results tab
I'll post tomorrow with some more details of the Manual Adjustments feature.
 
Last edited:
OP
pkane

pkane

Master Contributor
Forum Donor
Joined
Aug 18, 2017
Messages
5,699
Likes
10,383
Location
North-East
The Manual Adjustment feature was the result of thinking how can DeltaWave results be trusted. Just because it has algorithms to determine various parameters, doesn't mean these algorithms work perfectly in every instance. So, the question raised by some here and on that other forum is valid: how to verify the reported results? Here's one idea: try to come up with a better solution yourself! Enter Manual Adjustments:

Manual Adjustment is available under Process->Manual Adjustments menu. Run a Match operation at least once before, so that you have a good starting point for the process. Here's what the interface looks like:


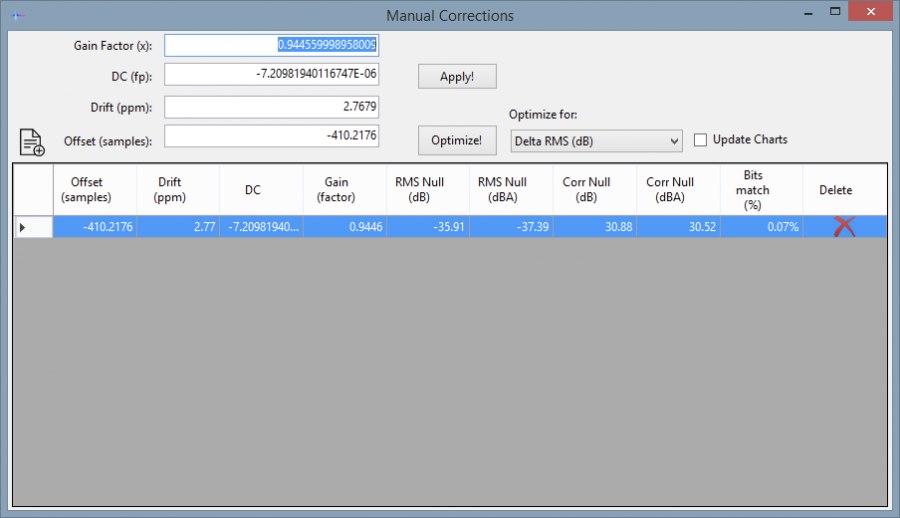
The settings up on top are all the variable parameters that DeltaWave tries to solve for:
  • Level difference expressed as gain factor and DC offset, and
  • Clock drift, and phase offset
When first shown, you will see the values that DeltaWave determined during the Match operation pre-filled, and the details of the result shown in the table below. Your mission, should you choose to accept it, is to find a better set of parameters that produce a better result than what DeltaWave found.

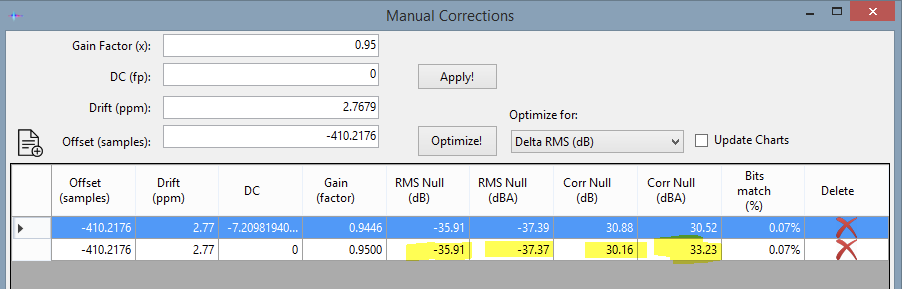
For example, if you decide that this DC offset appears very tiny and is probably the result of some noise in the tracks, simply change it to 0. That Gain factor looks suspiciously close to 0.95x, so let's change that as well, and then click Apply! DeltaWave will take your new settings and apply them to the two waveforms on the main screen, compute resulting match and add a new row to the table with your settings and resulting null parameters:


As you can see, a little improvement in the A-weighted results, but slightly worse over the entire bandwidth. Adjust something else, and try again. You can go back to any of the previous attempts by just clicking on that row. This will copy all the settings into the edit boxes above, so you can continue modifying. If you find a result useless and want to get rid of it, just click on the red 'X' next to it. Press the clipboard button above the list on the left to copy the results into Clipboard. You can then paste them into a spreadsheet or another editor for safekeeping or further analysis.

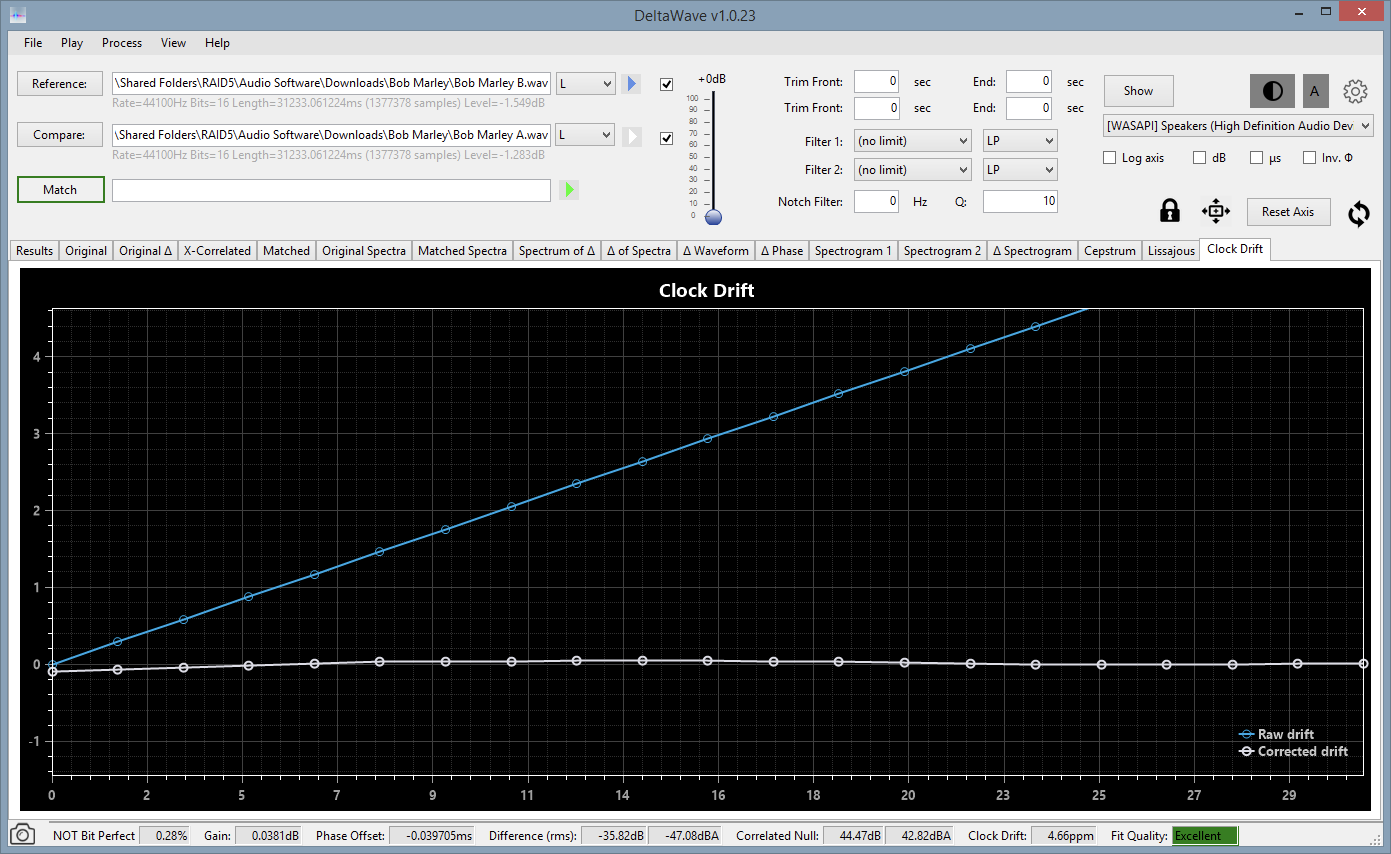
You can see the results of the process in the main DeltaWave window. Each Apply will update all the charts and the Results tab, just as if the match was generated by DeltaWave.

At some point, you may get tired of editing various different parameters and keeping track of the results. When that happens, try the 
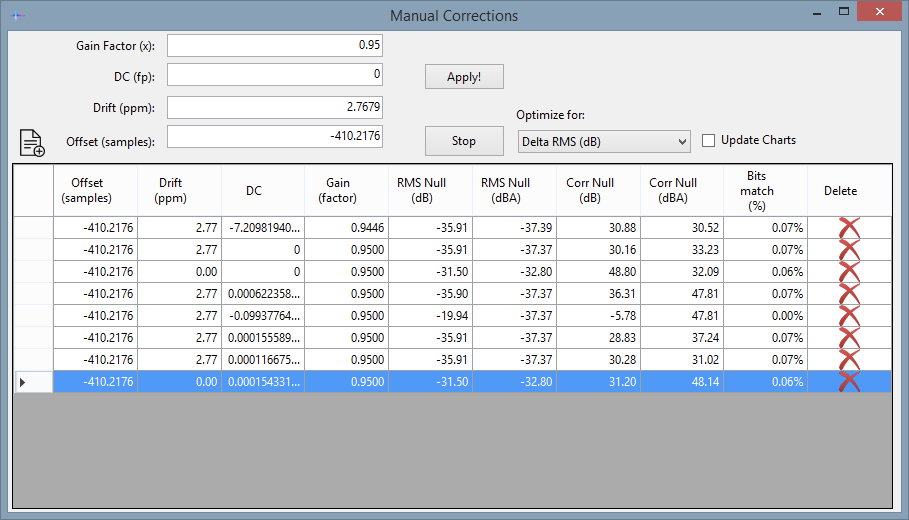
Optimize! option. This is a completely automated process that will attempt to alter the settings in a semi-intelligent way to get an improvement in the chosen result. It'll continue running for quite a while. Just select the parameter you want to optimize for from the drop-down list, and let it go to work.

Optimize runs experiments, just like you would manually, by altering the parameters, running a test, and then comparing the results. It will continue running for a certain number of tries (usually 80 or so), or until you stop it by clicking the Stop button. Only experiments that produce some improvement in any of the measurements are recorded in the list below. Leave the Update Charts option unchecked to speed up the process, or turn it on if you want to see the charts update in the main window during optimization.

When finished (or stopped), you may indeed find a better combination of parameters than what DW had originally determined. Select that result by clicking on it in the list, and then press Apply! to see it processed in the main DW window. That's all there is to it!

The Optimizer starts working on the initial settings in the text boxes above. If you want to change the starting point to something completely different, just enter those parameters into the text boxes before clicking Optimize! As you can see in the results below, no clear winners, although some parameters did pretty well in the A-weighted part of the measurements!

 
OP
pkane

pkane

Master Contributor
Forum Donor
Joined
Aug 18, 2017
Messages
5,699
Likes
10,383
Location
North-East
Just in case you have not figured this out yet — Delta Wave is really an experiment in the study of human brain sleep activity:

https://en.m.wikipedia.org/wiki/Delta_wave

The software doesn’t exist. You are all in a deep sleep state, with your brain generating a 0.8Hz-4Hz high amplitude signal that is, of course, properly phase- and level-matched.

When you wake up, you’ll feel refreshed, but realize that the software was just the product of your vivid dreams.

Happy dreams and happy April 1!
 
OP
pkane

pkane

Master Contributor
Forum Donor
Joined
Aug 18, 2017
Messages
5,699
Likes
10,383
Location
North-East
A lot of changes in DeltaWave version 1.0.23. Some are experimental, like the quality indicator and drift plot.
  • Added Quality of Fit indicator
  • Added support for AIFF file format
  • Added Clock Drift plot
  • Replaced stock library resamplers with my own FFT versions for better accuracy
  • Added axis lock/unlock option for each of the plots

Quality of Fit
Quality of fit indicates how large the clock difference remains after drift removal. The values shown on the status bar range from Very Poor to Excellent. The indicator will also degrade if the number of samples is low to indicate that the measurement may not be very accurate. This is a heuristic computation and may need to be fine-tuned.

Clock Drift Plot
This plot should help see if there are major errors in the drift computation. It shows two lines, one is the drift before the matching process (raw drift) and the other is what remains of the drift after matching. The values on the Y axis are phase offsets, expressed in samples. The X-axis is the time scale of the two tracks. The best possible result is a completely flat horizontal line positioned at Y value of zero.


Axis Lock
The lock icon (in locked position) synchronizes all the similar plots, so that zooming/panning in this one will affect all the others. If you want to zoom/pan a plot without affecting the others, click the lock icon to unlock it. Any changes on this plot will not be reflected in the others. To re-synchronize the plot with the others, click the lock button again.
 

Pluto

Addicted to Fun and Learning
Forum Donor
Joined
Sep 2, 2018
Messages
990
Likes
1,631
Location
Harrow, UK
1.0.23b
Looking very promising. A quick check suggests that if ’resample UP to the same rate’ is selected when one of the test files is DSD, a stop condition is (sometimes) encountered before computation is complete (NB not a crash, just a well-organised stop). Assuming this is because of the as-yet incomplete state of DSD handling, how feasible is it to trap such situations before commencing the computation? Unhelpful, but this seems tricky to reproduce consistently.

Please make the colour of the ’computing’ spinner bright red or something! At the moment it blends too nicely into the standard grey background. The graphic computing spinner is better, but could still do with making bigger, bolder (or more obvious in some other way).

The status display (very bottom of the window is useful but a bit “strobey” in appearance. While not a real problem, it would be good to improve this.

Something we have touched-on before: alignment of the plots for which the X axis is time, with the playback progress bar (under default zoom conditions). At the moment, the start of the progress bar and zero seconds are about 10mm apart (on my hi-res screen), creating an unhelpful offset between the waveform and the audio being played. I'm sure it would take a very small amount of work to improve this. There is a similar (but far smaller) offset between the right-hand end of the plot and the point at which the audio progress bar finishes.
 

Pluto

Addicted to Fun and Learning
Forum Donor
Joined
Sep 2, 2018
Messages
990
Likes
1,631
Location
Harrow, UK
A couple of points.

One set of files elicits the message, “residual drift error too large...try alternative?” Ought there be an option to proceed, by default, with the alternative method having recorded the fact in the log?

Having encountered this condition, the program proceeds with the alternative method and produces the output
Drift computation quality #2: Very Good (4.69μs)
Doesn't the latter condition appear somewhat incongruous with the former?

Some of the waveform plots' Y-axes are being drawn unnecessarily asymmetrically, thus, with rather odd Y-axis labels –
Untitled-2.jpg Untitled-3.jpg
Keep up the good work :)
 

Pluto

Addicted to Fun and Learning
Forum Donor
Joined
Sep 2, 2018
Messages
990
Likes
1,631
Location
Harrow, UK
Manual corrections screen

Stop ought to stop NOW, not when the current cycle completes (and discard incomplete entries in the table)

Could gain be entered in dB instead of a factor?

When pressing Optimize, would it be prudent/useful to switch to the (text) results tab so the user has an inkling of what's happening?

Is it worth showing table entries to greater accuracy than 2 decimal places?

Lastly (for now :)) are you reusing the 'loading data' phase as efficiently as possible? Particularly with DSD files, this takes an age so when running a long optimization, are you re-doing unnecessary work?
 
OP
pkane

pkane

Master Contributor
Forum Donor
Joined
Aug 18, 2017
Messages
5,699
Likes
10,383
Location
North-East
Manual corrections screen
Lastly (for now :)) are you reusing the 'loading data' phase as efficiently as possible? Particularly with DSD files, this takes an age so when running a long optimization, are you re-doing unnecessary work?

I agree that this might be nice, but keeping the original data in memory, as well as copies of it as it's being processed could easily result in out of memory conditions. Large DSD files converted to a high sampling rate in double floating point format can take up a gigabyte or more. Maybe I'll make this an option that's off by default.
 
OP
pkane

pkane

Master Contributor
Forum Donor
Joined
Aug 18, 2017
Messages
5,699
Likes
10,383
Location
North-East
A couple of points.
One set of files elicits the message, “residual drift error too large...try alternative?” Ought there be an option to proceed, by default, with the alternative method having recorded the fact in the log?

Having encountered this condition, the program proceeds with the alternative method and produces the output
Drift computation quality #2: Very Good (4.69μs)
Doesn't the latter condition appear somewhat incongruous with the former?

It may seem incongruous, but the message about Drift Computation Quality is the result of a measurement performed on the resulting drift correction. It's independent of the methods used to find the drift correction. Even though the alternative, less precise, drift computing method was used it apparently achieved satisfactory results :)

And a big thank you for testing DW updates and providing so much valuable feedback!
 
  • Like
Reactions: SIY

Pluto

Addicted to Fun and Learning
Forum Donor
Joined
Sep 2, 2018
Messages
990
Likes
1,631
Location
Harrow, UK
It may seem incongruous, but the message about Drift Computation Quality is the result of a measurement performed on the resulting drift correction. It's independent of the methods used to find the drift correction
That makes good sense; all the more reason for an option to proceed to the alternative method, if necessary, without seeking user confirmation to do so.
And a big thank you for testing
You're very welcome. I think this will become a significant program within the community. Audio Diffmaker was a brilliant concept but never sufficiently well executed. So far, you have well exceeded (and enhanced) the former's capabilities and marginal stability. Keep up the great work!!
 

Pluto

Addicted to Fun and Learning
Forum Donor
Joined
Sep 2, 2018
Messages
990
Likes
1,631
Location
Harrow, UK
Lock/unlock axes

I wonder if Delta Waveform ought not be included within the scope of the 'lock' which synchronizes the Y-axis 'gain' of the plots.

A release or three back you added the ability to change the 'gain' of the Y-axis. Typically, the Delta Waveform plot may well be >30dB down on the other plots that show level on the Y-axis. If you turn up the Y-axis gain on the Delta Waveform plot to make a well-nulled plot become visible (when the lock is engaged), the gain on the other plots becomes unhelpfully high.

Simple suggestion: exclude Delta Waveform from the scope of the "lock axes" function AND how about tracking the 'gain' of the Delta Waveform Y-axis with the setting of the "play delta" volume control?

Edit - just noticed that the lock can be disengaged from plots individually - so that one is solved :p

But it still might be cool to lock the gain of the Delta Waveform plot to the volume control.
 
Last edited:
OP
pkane

pkane

Master Contributor
Forum Donor
Joined
Aug 18, 2017
Messages
5,699
Likes
10,383
Location
North-East
Version 1.0.24 now available

Changes in 1.0.24b
  • Added support for IIR and FIR filters in settings
  • Improved ringing performance of LP/HP/Notch filters
  • Improved drift calculation precision
  • Removed the precision setting (always set to 30 now)
  • Added time axis display in samples, in addition to seconds, and microseconds
  • Added data caching option to the Manual Adjustment screen to speed up processing
  • Fixed clock drift plot to show the last calculated clock drift, instead of the next to last
 
Last edited:

restorer-john

Grand Contributor
Joined
Mar 1, 2018
Messages
12,703
Likes
38,844
Location
Gold Coast, Queensland, Australia
I notice the 60 day expiry doesn't stop the program working, just flashes up a message.

1554710568105.png


I've downloaded the later builds but still have an original early version on this machine.
 
OP
pkane

pkane

Master Contributor
Forum Donor
Joined
Aug 18, 2017
Messages
5,699
Likes
10,383
Location
North-East
I notice the 60 day expiry doesn't stop the program working, just flashes up a message.

View attachment 24603

I've downloaded the later builds but still have an original early version on this machine.

Try uninstalling the original version from Windows Control panel. Then reinstall.

The newer versions don’t expire.
 

Pluto

Addicted to Fun and Learning
Forum Donor
Joined
Sep 2, 2018
Messages
990
Likes
1,631
Location
Harrow, UK
1.0.24 looking very good. When reducing the gain of the Y-axes (i.e. making the waveform smaller), would it be an idea to limit the operation to the point where 0dB has appeared on the Y-axis?

Can the software now fall back to the alternative method of drift correction without requiring user input?

What's your thinking with regard to the various cosmetic issues I have raised, particularly the visibility of the spinners?

How do you feel with regard to my suggestion that it would be useful to better align the audio playback with the plots for which the X-axis is time?
 
OP
pkane

pkane

Master Contributor
Forum Donor
Joined
Aug 18, 2017
Messages
5,699
Likes
10,383
Location
North-East
1.0.24 looking very good. When reducing the gain of the Y-axes (i.e. making the waveform smaller), would it be an idea to limit the operation to the point where 0dB has appeared on the Y-axis?

Can the software now fall back to the alternative method of drift correction without requiring user input?

What's your thinking with regard to the various cosmetic issues I have raised, particularly the visibility of the spinners?

How do you feel with regard to my suggestion that it would be useful to better align the audio playback with the plots for which the X-axis is time?

All good suggestions, @Pluto . I'm still working on functional aspects of the software. I'll get to the cosmetic issues that are easy, quickly, others may have to wait a bit.
 

RayDunzl

Grand Contributor
Central Scrutinizer
Joined
Mar 9, 2016
Messages
13,250
Likes
17,183
Location
Riverview FL
GUI thought:

Left/Right scroll bar for the display.
 

RayDunzl

Grand Contributor
Central Scrutinizer
Joined
Mar 9, 2016
Messages
13,250
Likes
17,183
Location
Riverview FL
Just the chart.

Your call, dragging the chart is more tedious than clicking to move it when magnified.
 
Top Bottom