I have studied the frequency response of the 805D4 in detail over the last few days and can only partially agree with your statement. Especially in the low frequency range, the Batman target is clearly missed. I don't want to offend you, but it's a complete mystery to me how you could have missed that - B&W fan boys are probably everywhere.
Here is my extensive frequency response research as proof - these studies are my legacy to future generations and I cannot laugh at all when inaccurate reports are made in this regard.
View attachment 158624
Hahah that is really even closer than I expected.
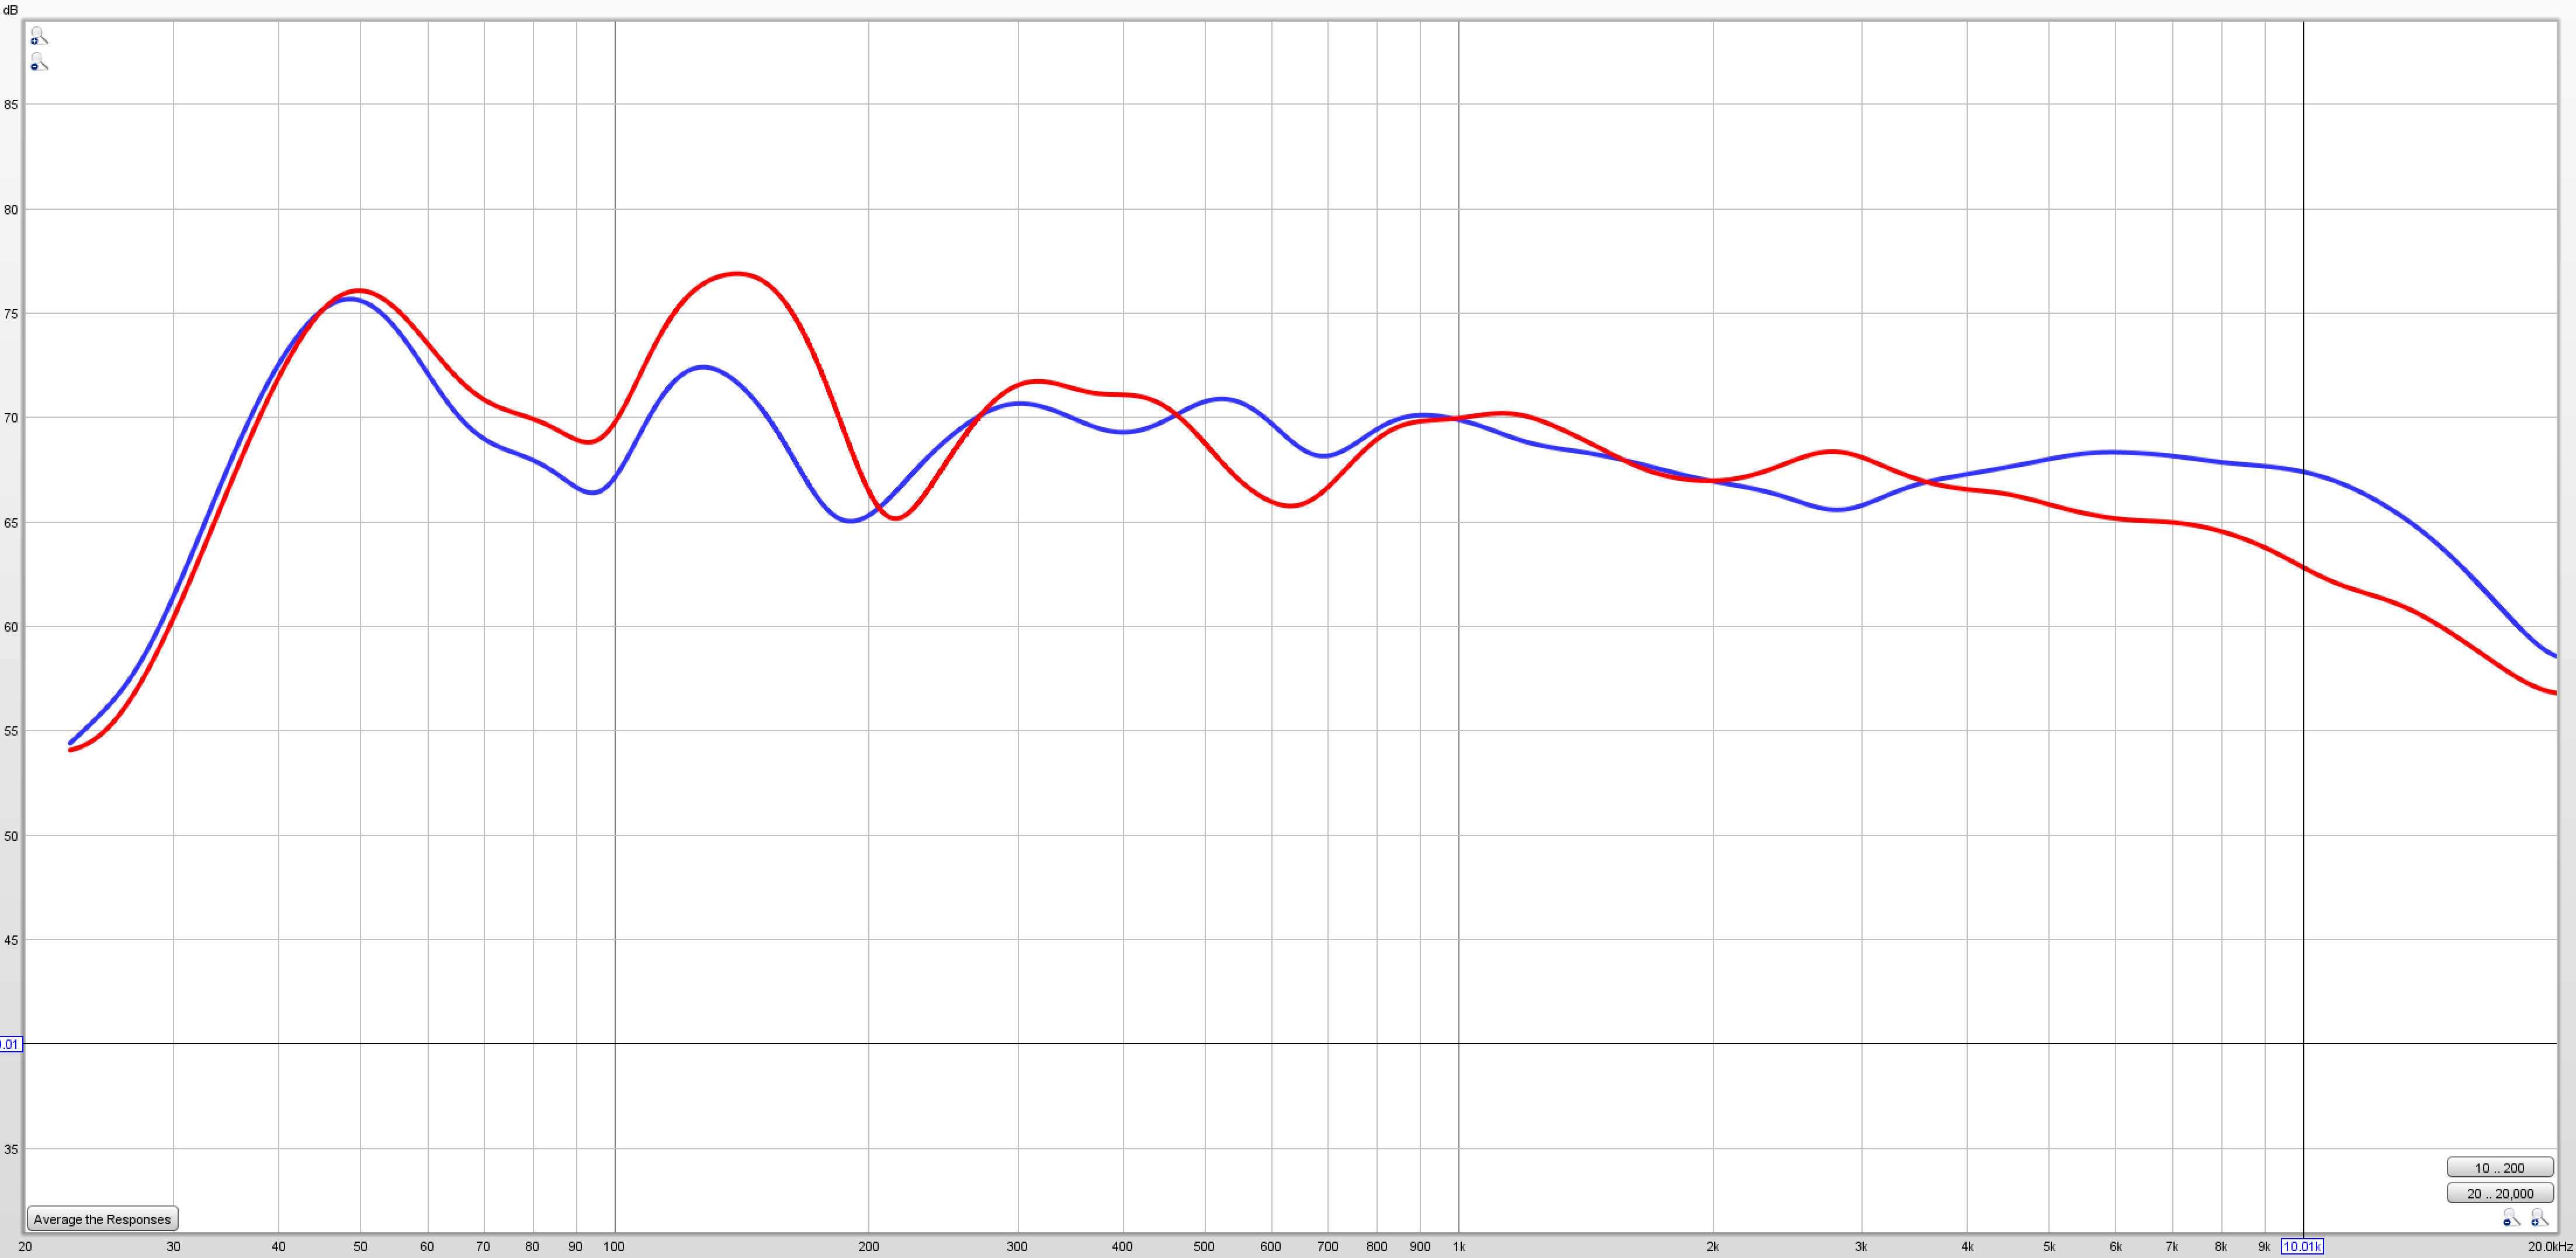
As fun as it is to mock the LW and off-axis response curves, what ultimately matters is the actual in-room response.
I happen to have
in-room measurements of the
805D2 (2 generations older), shown in
BLUE below. Perhaps, of interest, I also have in-room measurements of the Revel PerformaBE
m126Be, shown in
RED. Both were taken in the same room using a calibrated UMIK-1 and an average of 3 readings each.
Even though the on-axis LW FR of the 805D2 is also "bat-wing" (not shown), the
actual in-response below is pretty good.
It turns out, the Revel is the one with excessive energy in the midbass region and overall sounded a bit rolled off in the highs in the same room. I actually took these measurements to better understand why the m126be sounded "dull" to me.
Perhaps some food for thought - it's actually pretty difficult to predict the in-room response just by eyeballing a series of FR charts. Just because the tweeter on-axis (or on-axis LW) FR curves look a certain way to you, doesn't mean the actual response will look the same, as this demonstrates.
I don't mean to be argumentative as I don't know how productive it is to continue what seems to be some fundamental disagreements, (even though I think we agree on many things too). But for the sake of friendly debate I will point some things out:
1) Having created full spinoramas and measured the in-room response for several dozen speakers, there is a strong correlation between the in room response and the measured PIR, and you get a pretty good feel for how the calculation is going to turn out after some time looking at measurements. I know, I know, people aren't excel spreadsheets that can calculate this stuff in their head instantly, but look at enough measurements and trends start to emerge.
Sure, there are occasional outliers, but not many and I don't recall many any dramatic deviaitons, especially from 1-kHz to 10kHz. You definitely need vertical information to really know, but usually the horizontal data alone will give you a good sense of what to expect, and you can make some educated guesses based the drivers and crossover. Or simulate it.
I've
written before about how few measurements you actually need to get something quite close to the full spinorama in *
most* cases. 11 measurements is usually enough for vituixcad. Probably less with a bit of elbow grease as you can guess some of the extreme off-axis angles.
2) That in room response doesn't look terrible, but not that good to me either, with the scoop from 1-5 khz in particular given the short scaling. Of course, some listeners may enjoy that sound. Not making a commentary on that, just that in my opinion it doesn't look very good.
3) I forget which paper it's in, but worth mentioning in one of the harman papers they found better correlation with listening impressions from the PIR than from the actual in room response. I imagine due to the increased resolution.
4) Not really a counterargument, but another thing adding 'fuzziness' to all this is how people actually measure the predicted in-room response. The methodology is laid out in the Olive 2004 part II. Just posting that here as I rarely see people mention this:
"In-room measurements were made of the 13 loudspeakers from Test One using the exact physical setup used for the listening tests. A diffuse-field
microphone was positioned at the listener’s chair, at average ear height, 3 m. away from the loudspeaker. The loudspeaker was placed 1.2 m from the rear wall, slightly off-center from the side walls of the room. A total of 9 measurements were taken at 0, ± 10, ± 20 and ± 30 horizontal, and ± 10 vertical."
So ideally averaging should have 9+ measurements over the listening window. Indeed, following a similar methodology has given me the closest results, though I tend to just do MMM when measuring quickly. Depending on how wide of an area you measure over, how you aim the microphone etc can affect how close your in-room response is to the PIR.
5) I disagree what ultimately matters is just the in-room response. it's always a balance of the direct sound and in-room sound. You likely know that, but just pointing out it's not like we should be ignoring the LW in favor of the in-room response, especially at higher frequencies.